Dashboards
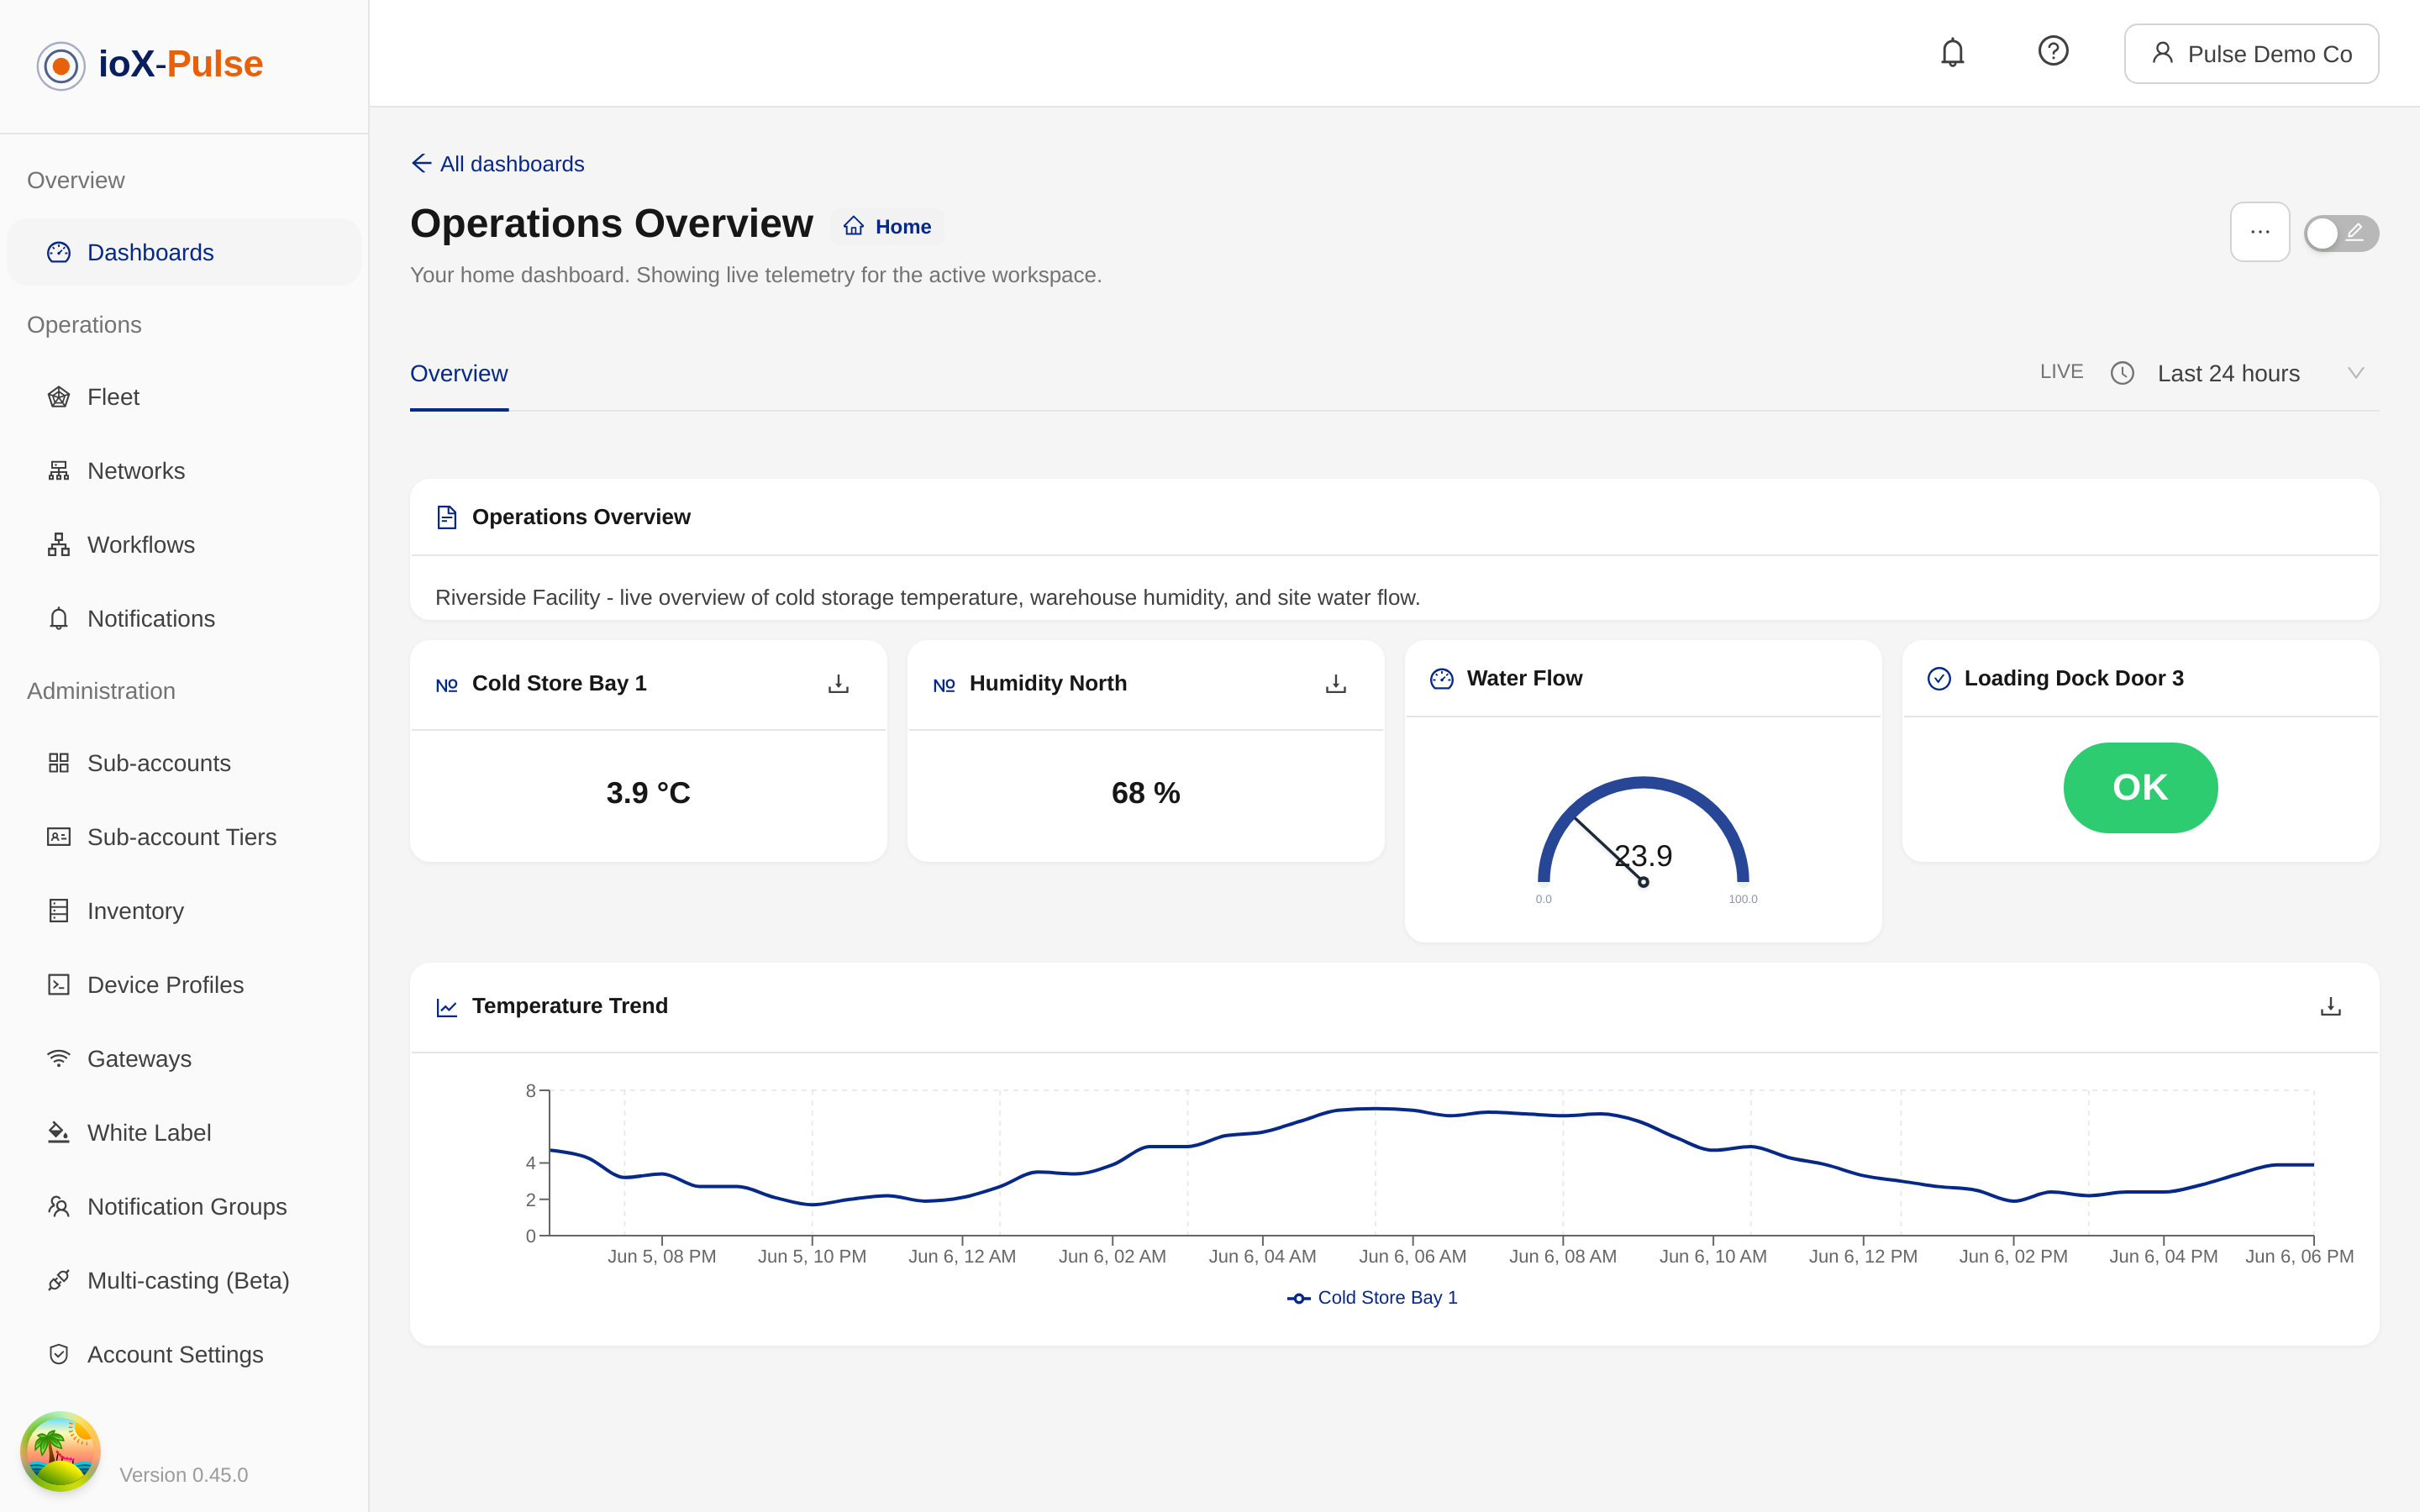
Dashboards are how your team and your customers actually use the data ioX-Pulse collects. Drag widgets onto a grid, bind them to device fields, and you get a live view of fleet health, customer KPIs, or a single device's vitals. This page covers the dashboard system end-to-end. Each widget type has its own widget reference page.
Where to find it: Sidebar -> Dashboards (partner-wide list) or any sub-account -> Dashboards (sub-account list).
Dashboard scopes
Every dashboard has a scope that determines what data it can bind to and who can see it.
| Scope | Purpose | Visible to |
|---|---|---|
| Fleet | One workspace-wide read-only operations view across all your sub-accounts. Singleton. Curated by ioX-Connect for now. | Partner Admin, Partner Support |
| Partner | Custom workspace-wide dashboards you build. Widgets can bind to any device in any sub-account. | Partner Admin, Partner Support |
| Sub-account | Customer-facing dashboards inside a single sub-account. Widgets only bind to that sub-account's devices. | All members of that sub-account |
| Profile | Reference dashboard that renders once per device of a given device profile. Configure the layout once, every device of that profile uses it. | Partner Admin, Partner Support |
| Device | Per-device dashboard for an individual device. Build special views for devices that need bespoke instrumentation. | Whoever can see the device |
Picking the right scope:
- Use Sub-account for customer-facing dashboards. Most of what you build will be this.
- Use Partner for cross-customer roll-ups (e.g., "all our devices' battery levels at a glance"), only visible to your internal team.
- Use Profile when a whole class of devices (e.g., every smart meter you sell) needs the same view. Editing the profile dashboard updates the view for every device using that profile.
- Use Device sparingly. Reserve for devices that genuinely don't fit any reusable pattern.
- Fleet isn't something you create. It exists by default. We may make it customizable for partners in a future release.
Creating a dashboard
- Pick the scope you want (see above). For sub-account dashboards, switch into the sub-account first from the scope selector at the top of the sidebar.
- Dashboards -> + New Dashboard.
- Name the dashboard (e.g., "Fleet Health", "Acme Operations", "Daily Production").
- Create.
You land on an empty dashboard ready for widgets. To make it the one you land on each time, see Home dashboard below.
Permission required: Partner Admin for any scope. Sub-account Admin (or a Sub-account Operator you've granted the manage-dashboards permission) for sub-account-scoped dashboards in their own sub-account. Sub-account editing also requires the sub-account dashboard editor tier feature.
Tier limits. Your tier may cap how many dashboards you can create per scope. If you hit the cap, you'll see an inline error when you try to create a new one. Archive or delete old dashboards to free a slot, or upgrade tier.
Adding widgets
The widget editor is grid-based, drag-to-resize, drag-to-rearrange. No save button, changes commit automatically.
- Toggle Edit mode on (top-right of the dashboard).
- Click + Add widget.
- Pick a widget type from the picker; everything in the widget reference is on this list. A few widget types are tier-gated: if your tier doesn't include one it still appears in the picker but is grayed out with a "Tier-gated" label, so you can see what an upgrade would unlock. Contact ioX-Connect support to confirm what's included.
- The widget appears in the next empty slot with a default size.
- Click the widget's settings icon to open the config drawer. Bind it to a device + field, set thresholds, customize the appearance.
- Save the widget config. Drag the widget to rearrange or resize it.
When the account's tier includes Analytics (Beta), a second button, + Add visualization, sits next to + Add widget and places a saved visualization on the dashboard as a tile. See the Visualization widget for what it can embed.
For details on every widget type, jump straight to the relevant reference:
- Value - single big number or text reading.
- Chart - time-series chart with up to 10 series.
- Gauge - radial, linear, liquid, battery, signal, compass gauges.
- Status - colored pill indicator (connectivity, field-rule, or alert state).
- State Timeline - state bands over a time range (motion, machine running hours, online/offline history).
- Gateways - roster of gateways with online/offline, last seen, and traffic/health stats.
- History - tabular event log.
- Embed - an external web page in a sandboxed frame (tier-gated).
- Visualization - a saved Analytics visualization at its own period (tier-gated, beta).
State fields that report only on change (a valve's open/closed state, a door, a relay) can otherwise read "No data in this range" once the last change scrolls out of the window. Value and Gauge widgets showing the latest reading fall back to the device's last known value automatically, with an "as of" timestamp. For Status widgets, charts, and history tables, which read only the selected window, turn on Retain last value for the field on its device profile and they will keep showing the last reported state.
The first time you open an empty dashboard, you may see a Seed defaults option that drops a starter set of widgets onto the dashboard. Useful as a starting point; everything is editable afterward.
The grid
The dashboard layout uses a 12-column grid:
- Widgets snap to grid cells. Default widget size is 4 columns × 4 rows.
- Drag a widget to reposition; drag the bottom-right corner to resize.
- Widgets reflow when the browser narrows (small screens collapse the grid to fewer columns).
- Each widget has a minimum size (most are 2×2; small widgets like buttons can go to 1×1).
Edits autosave on drag-stop and resize-stop. No "save" or "discard" button: what you see in edit mode is the live dashboard for everyone else once you exit edit mode.
Tabs
A dashboard can have multiple tabs. Use them when one dashboard would otherwise have too many widgets, or when you want to separate concerns (e.g., "Overview" + "Detailed Stats" + "Alerts").
- In edit mode, click + Add tab at the top of the dashboard.
- Name the tab.
- Build widgets in the new tab; each tab has its own widget set.
The dashboard URL includes ?tab=<id> so you can deep-link to a specific tab. The time range picker is shared across tabs, change it once and all tabs reflect the new range.
Time range
The time range picker sits at the top of every dashboard. Presets: Last 15 minutes, Last 1 hour, Last 6 hours, Last 24 hours (default), Last 7 days, Last 30 days.
How widgets use it:
- Most widgets inherit the dashboard time range by default. Changing it on the dashboard re-queries every widget.
- Individual widgets can override with their own time range in their config drawer. Useful for "current value (last hour)" alongside "history (last 30 days)" on the same dashboard.
For device-scoped dashboards, time range still applies; the bound device's data is windowed against the picker's range.
Live data
Telemetry flows live. As new uplinks arrive from devices, dashboards update in place; no refresh needed:
- New points stream in via a WebSocket connection per device.
- Charts add new bars/points to the right edge.
- Value, Gauge, and Status widgets refresh their current reading immediately.
- History widgets prepend new rows.
If the connection drops (network blip, server restart), the dashboard reconnects with exponential backoff (1 second up to 30 seconds). When live data isn't available, widgets fall back to range queries on the time picker.
Who sees what
Visibility is decided in two steps: the dashboard's scope sets the broad audience, then its Access setting can narrow that audience further.
By scope:
- Sub-account members see sub-account-scoped dashboards for their sub-account, plus their own device dashboards. They don't see partner-wide or fleet dashboards.
- Partner Admin / Partner Support see all dashboards across all sub-accounts and the fleet view.
Access: limiting who sees a dashboard
Open a dashboard, then use the three-dot menu -> Access. Choose one of:
- All members (default): everyone the scope above already allows.
- Only selected members: pick specific people. Only they (plus admins) see the dashboard.
- Only members of selected sites: sub-account dashboards only, and only when multi-site is enabled. The guiding rule is that a member sees dashboards for their own site and any site below it, but never a site above it. So if you link a dashboard to a parent site, a member restricted to a child site beneath it will not see it; if you link it to a child site, members of that child (and of any parent site above it) see it. Members with no assigned site see it too.
A few rules keep this safe and predictable:
- Admins always keep access to dashboards they manage, whatever the Access setting, so you cannot lock yourself out.
- Access only narrows, never widens. A sub-account dashboard is never shown to another sub-account, and a partner dashboard is never exposed to sub-account members.
- Site access stacks with multi-site filtering. A member still won't see a dashboard whose widgets all point at devices outside their own site, even if you grant them access. In that case the dashboard would simply look empty for them, so the Access editor warns you when a chosen member is limited to a single site.
Partner dashboards offer All members and Only selected members only. There is no site option for them, because sites belong to sub-accounts.
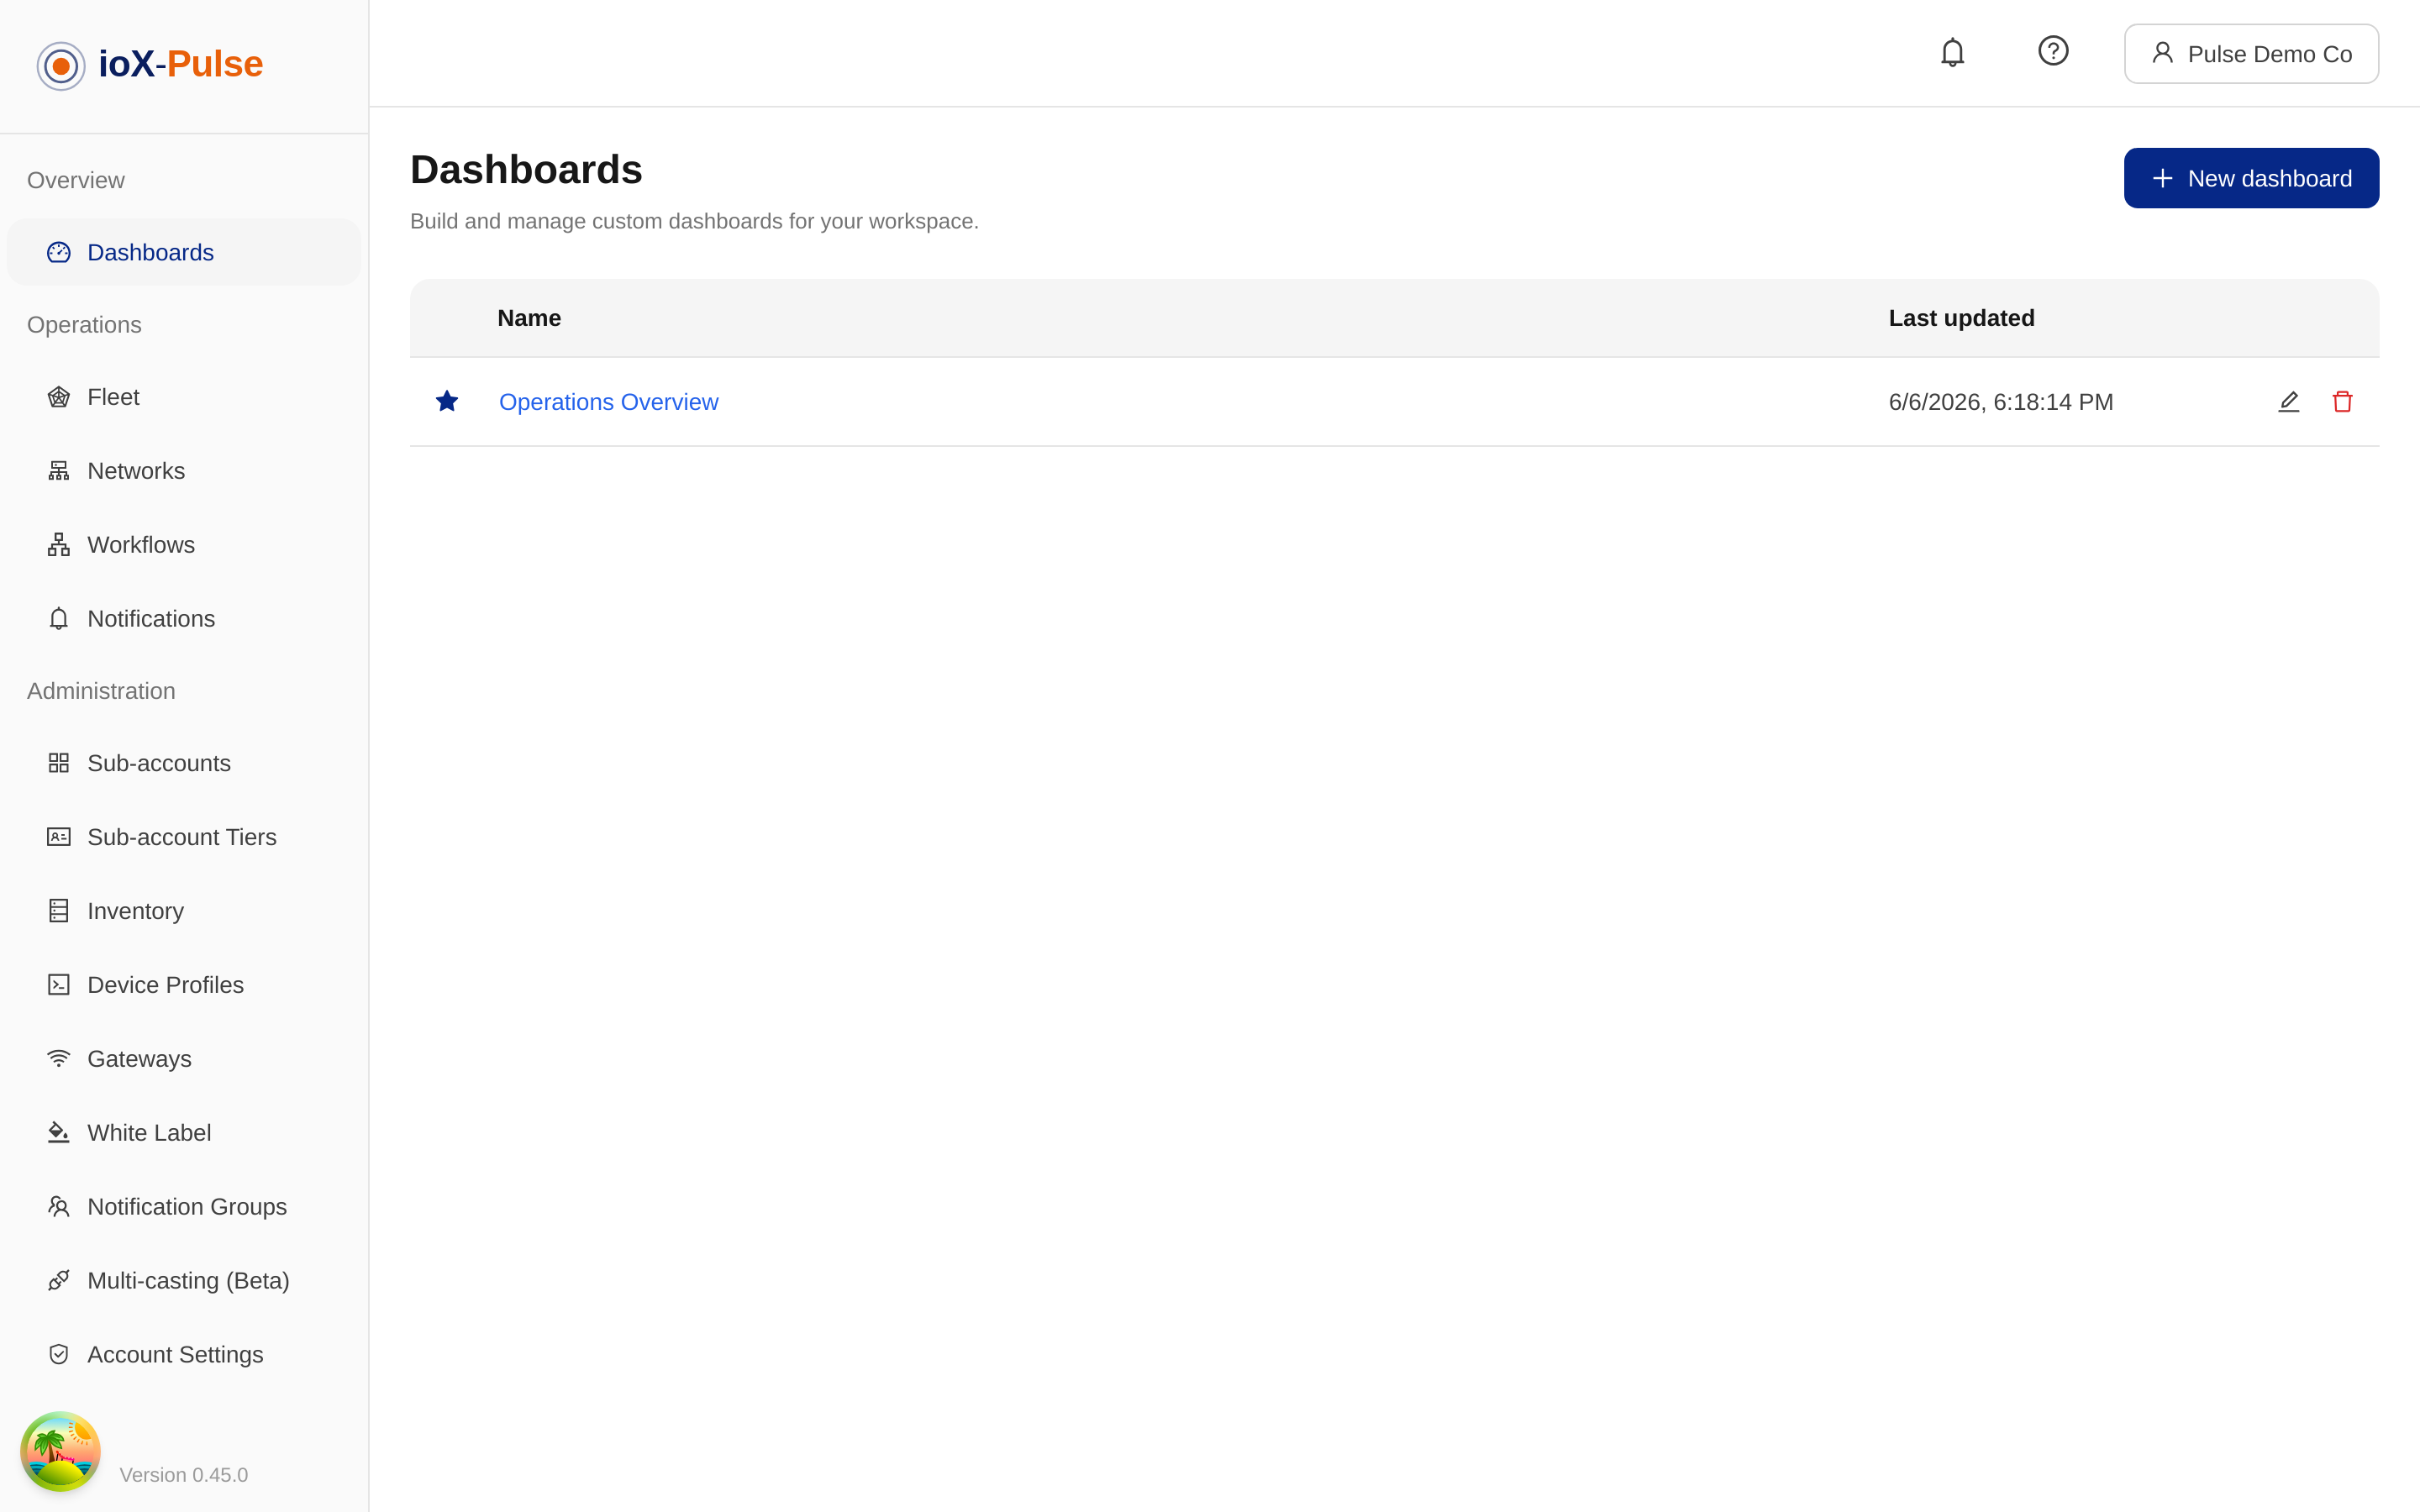
The current setting is shown at a glance: the Dashboards list has an Access column, and an open dashboard shows an access tag next to its title (for example "All members", "3 members", or the site name). That way you can always tell who a dashboard is linked to without opening the editor.
Public dashboard links
A sub-account dashboard can be shared with people who have no account at all, through a link that opens in any browser. It suits wallboards on a factory floor and customers who want to watch their own site without signing in.
The step-by-step, including passwords and letting viewers act, is in the end-user guide so your customers can follow it directly: Sharing a dashboard with a public link. What follows is what only you control.
Turning it on for a customer
Sharing is gated by the Public dashboard links feature on the sub-account's tier, and it is off unless you include it. Add it to a tier under Sub-account Tiers, and every sub-account on that tier can start sharing. Take it off a tier and no new links can be created, but any live link keeps working until someone turns it off, and turning a link off is never blocked. That way a plan change can never leave a customer with a link they cannot switch off.
Only sub-account dashboards can be shared. Partner-wide, fleet, profile, and device dashboards have no Share option.
Your branding on a shared dashboard
A shared dashboard shows no platform branding. To put your own mark on it, upload a Powered by logo under White Label -> Branding -> Portal options and turn on Show Powered by mark, then Save. It renders small, at the bottom-right of the page, and you can point it at your own site with Logo link. Leave the logo empty and the page stays unbranded.
What keeps it safe
- Viewers only reach what the dashboard shows. The link grants access to exactly the devices, fields, and readings the dashboard's widgets are bound to, and nothing else in the account. Adding a widget widens that; removing one narrows it again.
- Actions need a password. Set Value and downlink actions can only be enabled on a password-protected link, and each is off by default. Removing that protection is not possible in place: the link has to be replaced, so a link already in circulation never silently gains or loses a password.
- Turning a link off is immediate. Anyone viewing loses access on their next refresh, and any password they had is useless.
- Site-restricted admins cannot create links. A shared dashboard covers a whole sub-account, so an admin limited to particular sites is asked to have an unrestricted admin share it instead.
- Every link creation, change, and removal is recorded in the audit log, and so is every action a viewer takes through a link.
Home dashboard
The home dashboard is a personal setting: each member chooses the one dashboard they want to land on when they open Dashboards. It is per user, so everyone (admins and regular members alike) sets their own, and one member's choice never affects another's.
Set or change it in any of these places, all of which do the same thing:
- On the Dashboards list, click the star next to a dashboard. A filled star marks your home; click it again to clear it. Only one can be your home at a time.
- Open a dashboard, use the three-dot menu -> Set as home dashboard (it then offers "Remove as home dashboard"). The dashboard shows a small Home tag while it is yours.
- Under Account settings -> Profile -> Default landing page, where you can pick a dashboard or a Fleet tab.
As an admin you can also set a member's home for them from Members -> (member actions) -> Edit profile; the picker there lists only the dashboards that member can see.
When a member opens Dashboards, they land on their chosen home if they can still see it; otherwise on their most recently updated visible dashboard; otherwise the Dashboards list. So no one is ever sent to a dashboard they cannot see, and if a chosen home later becomes unavailable it falls back automatically. This is especially handy for site-restricted members, who can set their own site's dashboard as home.
Editing a profile dashboard
Profile dashboards are special: editing them updates the view for every device using that profile. The editor shows you the device count and a warning before saving major changes.
Like the main dashboards, a profile dashboard opens read-only. Toggle Edit mode (top-right) to add, move, resize, or configure widgets, then toggle it off when you are done. Changes autosave as you go.
Preview with live data. A profile dashboard has no device of its own, so its widgets normally render as placeholders. To check the impact of your changes against real telemetry, use the Preview live data selector at the top of the editor and pick any device already using this profile. The widgets then render that device's actual data in place, so you can adjust a binding, threshold, or layout and see the result without leaving the editor to open a real device page. The choice is remembered per profile. Mutating actions (acknowledging an alert, sending a downlink) are disabled while previewing, so you cannot act on the seeded device by accident.
Add fields first. Widgets on a profile dashboard bind to fields, so the dashboard editor stays empty (Add widget disabled) until the profile has at least one field. If you're seeing the "No fields on this profile yet" banner after cloning from a template, open the Fields tab and add or derive fields before composing the dashboard.
When you bind a widget on a profile dashboard, you bind to a field (e.g., temperature). At render time, each device using the profile sees the widget bound to its own device's temperature reading. The deviceId is implicit.
This is the right model for managing many devices of the same kind without re-building dashboards device-by-device.
Removing a dashboard
- Dashboards list -> three-dot menu on the row -> Delete.
- Confirm.
Dashboards are soft-deleted, meaning the row stays in the database for audit but the UI hides it. If you've deleted by accident, contact ioX-Connect support to restore.
When you delete a dashboard, any users viewing it at the time are redirected back to the Dashboards list on their next action. The same happens to anyone following a stale link to a dashboard they can no longer see.
Permission required: Partner Admin for any scope, or Sub-account Admin for sub-account-scoped dashboards in their own sub-account.
Frequently asked
Can I copy a dashboard?
Not via a "Clone" button today. The workaround: create a new dashboard, manually add the same widgets with the same configs. Clone is on the roadmap.
Can a sub-account user create their own dashboards?
Yes, when their tier has the sub-account dashboard editor enabled. Sub-account Admins can create and edit dashboards within their own sub-account by default. Sub-account Operators can do the same if you grant them the manage-dashboards permission via a role-permission override; Viewers are always read-only. The customer-facing walkthrough lives in the end-user guide: Building dashboards.
What happens when a bound device is deleted?
Widgets that bound to that device show a "Device not found" placeholder. The dashboard still works; rebind the widget to another device, or delete it.
Can I embed a dashboard in another website?
Not via a clean embed URL today. You'd need a custom integration. Talk to your account manager if this is critical for a customer.
Why don't I see the Fleet dashboard?
Fleet dashboard access is feature-gated by your tier. If your partner tier doesn't include the fleet scope, you won't see the Fleet item in the sidebar. Contact ioX-Connect support to confirm what's included.