Well Site Monitoring dashboard
The Well Site Monitoring dashboard is for oil and gas producers who run many wells: which wells are pumping, idle, down or not reporting, which tanks are high, low or draining fast, what came out of the ground yesterday, and which tubing, casing or line pressures are outside their band. You choose the wells, the dashboard reads every stroke counter, pressure sensor, tank level sensor and volume meter in them, and each morning it can email yesterday's report to a notification group. There are no widgets to place.
This dashboard is in beta. It is being tested with early users and may change. Please tell your provider what you find.
Do you have this? Dashboard templates are a plan feature, and this one also needs Multi-site, because a well on this dashboard is a site. If the New dashboard dialog does not offer a Well Site Monitoring type, your provider has not enabled it for your workspace. Creating the dashboard, choosing devices, assigning roles and changing settings needs Workspace Admin access (or an Operator who has been allowed to manage dashboards). Everyone who can open the dashboard can read it, export its tabs and generate reports.
How wells are modeled
- One site per well. Each well has its own site; a lease, a pad or a field sits above it.
- Every device in its well's site. A device in no site belongs to no well and is never read.
- One device per pressure role per well. One tubing, one casing, one line pressure; an extra device with the same role is not read.
The dashboard uses your sites:
- A well is a site. Create a site for each well and attach the well's stroke counter and pressure sensors to it. Sites above the well, such as a lease, a pad or a field, are used for grouping and roll-ups; the dashboard follows whatever tree you built. See Sites for how to arrange them.
- A tank sits on the site it serves. A well's own tank goes on the well site; a tank battery that serves several wells goes on the lease or pad above them.
- Every device has a role. A stroke counter, an oil meter and a water meter get their role automatically when they join the dashboard, because they can be only one thing. A pressure sensor can be the tubing, casing or line pressure of its well, and a level sensor can be an oil tank or a water tank; you choose those on the Devices tab, one device at a time or one role for every unassigned device in a site.
A site with a stroke counter or a pressure sensor in it is a well. A site with meters but no stroke counter is reported at lease level on the Production tab, with its metered oil and water.
When two devices in one site hold the same role, the dashboard reads the first by name and ignores the other; the Devices tab marks the extra with Shares the ... role and names the device that is read. A device with a role but no site is marked Not in a site. A banner above the device list counts both cases while either exists.
What a device needs on its profile
The dashboard reads tagged fields and nothing else. On the device profile, tag:
- the stroke count field as Stroke count (strokes), with its aggregation kind set to Counter (a count since the last report) or Absolute (a running total that only goes up);
- a pressure field as Pressure (PSI);
- a tank level field as Fluid level in percent, inches or feet, holding the level in the tank in that unit;
- an oil or water volume meter field as Oil volume (bbl) or Water volume (bbl), with its aggregation kind set.
How the reading is produced is up to the profile: a formula such as motion/2 on a motion sensor that counts the up swing and the down swing, a pulse count, a decoder output, or a formula that turns a measured distance into a percent for a tank of a known height. See Customizing profiles.
Creating the dashboard
- Go to Dashboards in the sidebar and click + New Dashboard.
- Choose the Well Site Monitoring type and give the dashboard a name.
- Choose the reporting time zone and the clock format.
- Click Create, then Select devices.
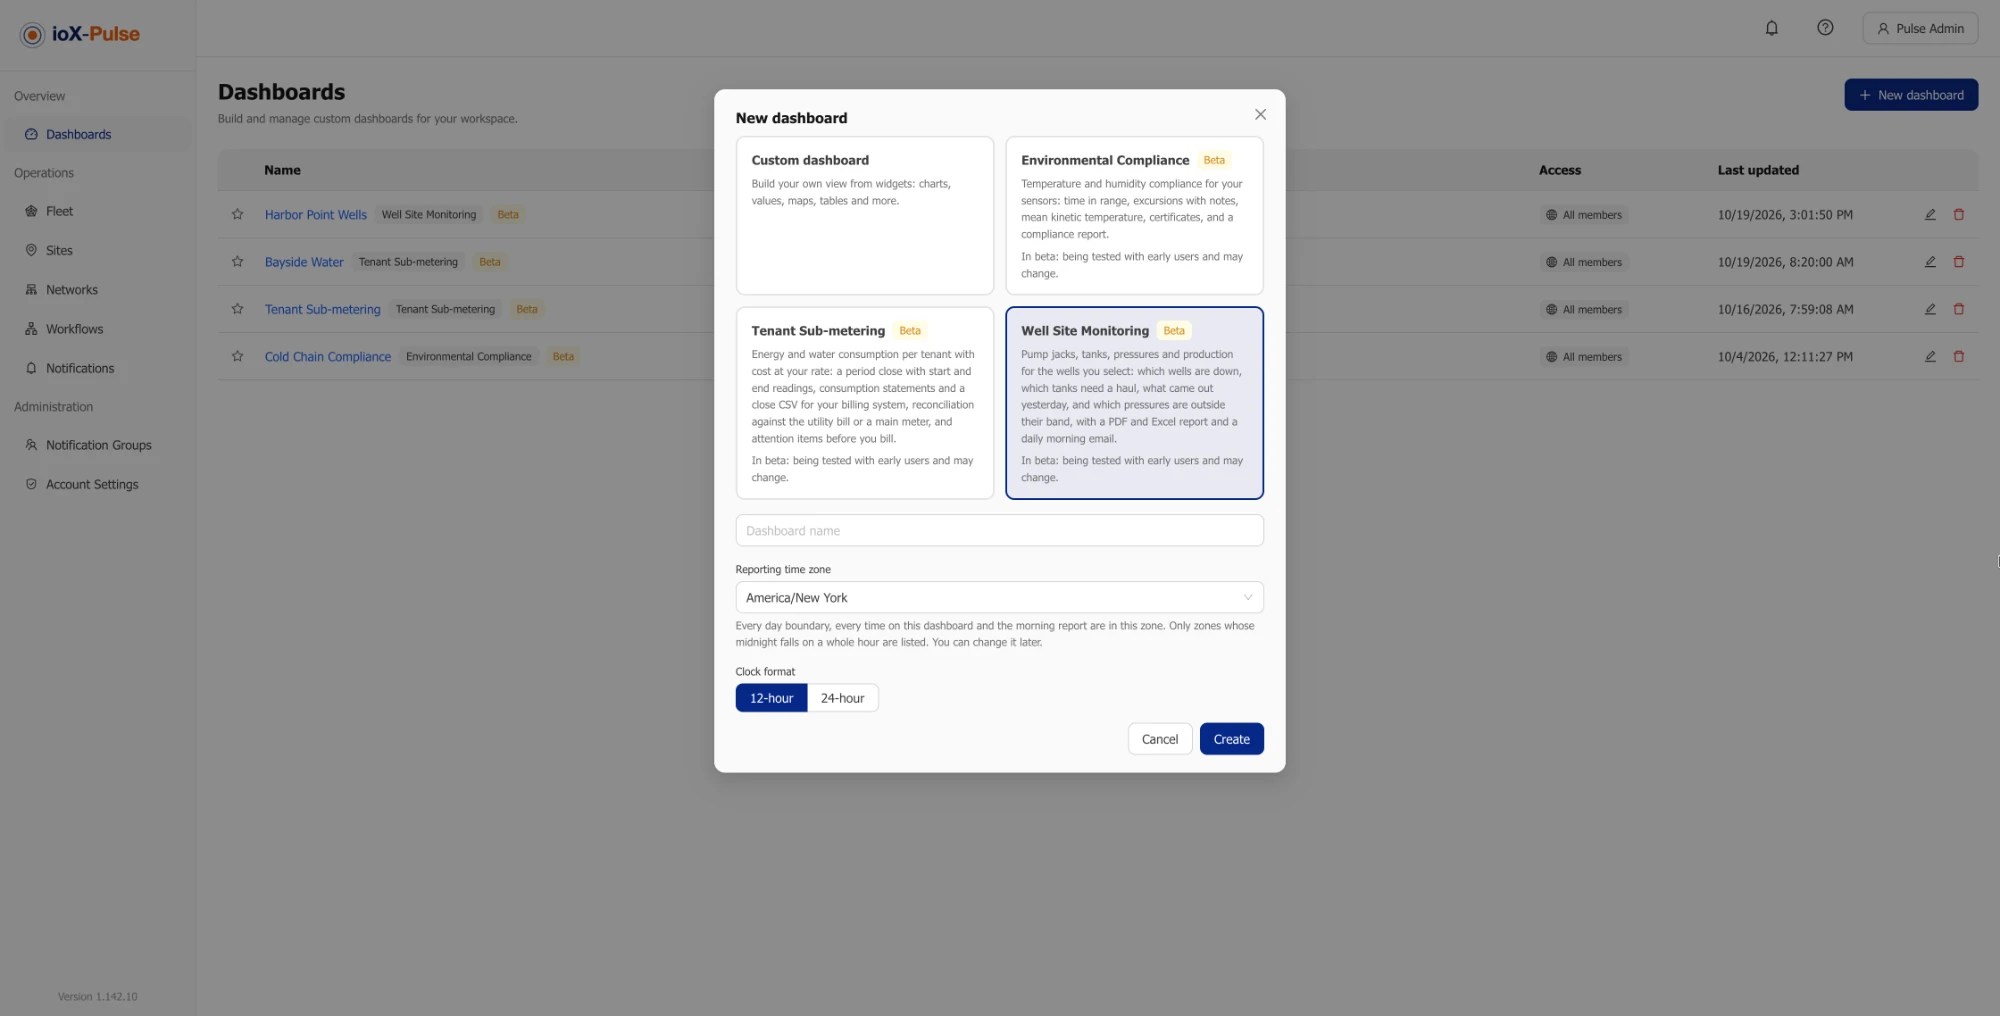
The time zone belongs to the dashboard, not to the person reading it. Every day starts and ends at midnight in that zone, and every time on the dashboard, in its exports and in its reports is shown in it.
Who can do what
| Action | Who |
|---|---|
| Open the dashboard and read every tab | Everyone the dashboard is shared with: Viewers, Operators and Workspace Admins |
| Export a tab, generate reports and download them | Everyone who can open the dashboard |
| Create the dashboard, choose devices, assign roles, change settings, delete it | Workspace Admins, and Operators who have been allowed to manage dashboards |
A teammate who is limited to a site sees this dashboard only when everything it includes is inside their site, and can download a report only when every site in it is one of theirs. It is all or nothing: the dashboard never shows them a partial picture that could be mistaken for the whole. The daily morning email covers the whole dashboard, so members of the notification group who are limited to a site are skipped, and the Reports tab says how many.
Who the dashboard is shared with is set from its ⋯ menu, the same as any other dashboard. A template dashboard cannot be shared by public link.
Choosing devices
Open the dashboard and select Select devices, or Settings then Devices. Tick a field, lease or pad to include every eligible device in it and in the sites beneath it, now and in future, or tick devices one by one. A device that is not eligible shows the reason: usually a field that is not tagged, or a stroke or meter field whose aggregation kind is not set.
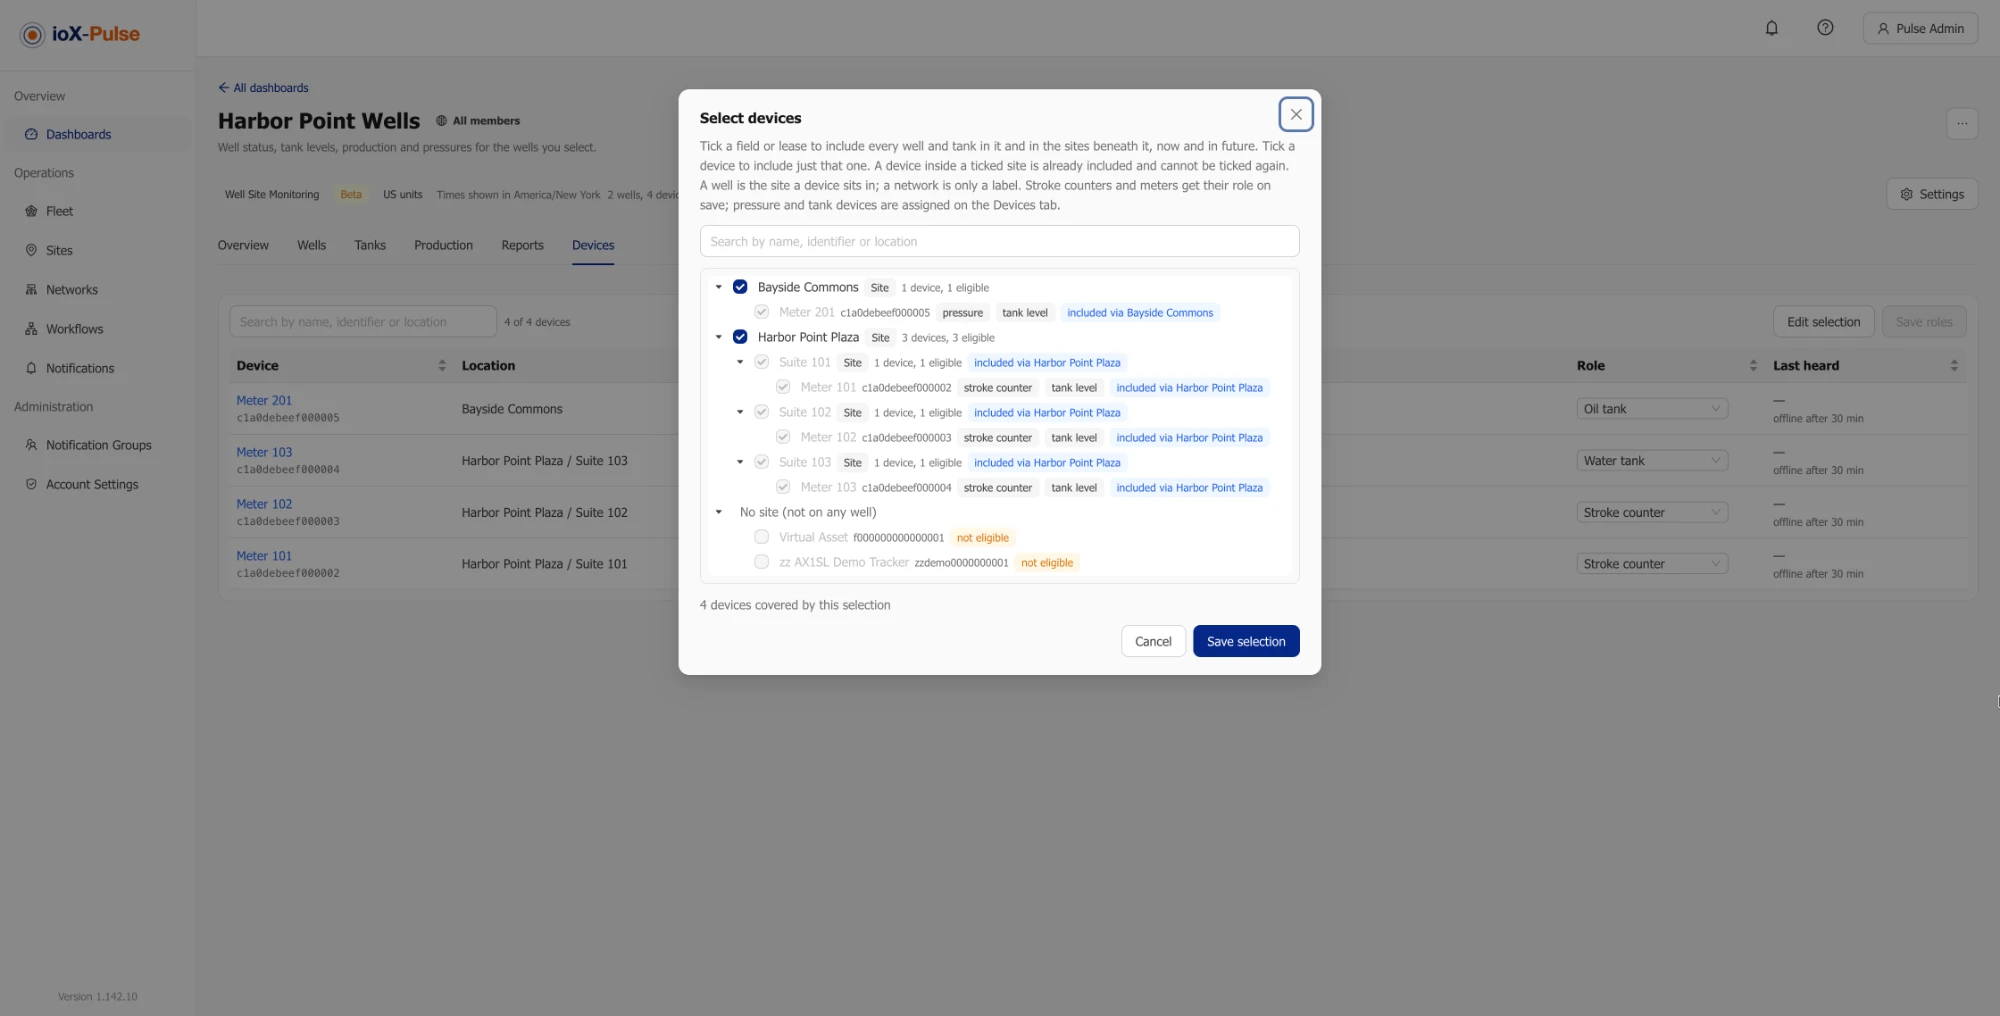
Each included device is listed on the Devices tab with its site and its role. A device that could be more than one thing (a pressure sensor, a level sensor) has no role until you give it one: choose it on the row, or use Apply to give one role to every unassigned device of that kind in a site. Up to 300 wells and 1,000 devices can be on one dashboard.
The site filter
Above the tabs, Everything or one site. Choose a lease, a pad or a well and every tab, every export and the next report cover that site and everything beneath it. The filter is in the page address, so a link reproduces the view.
The line beside it reads Readings through followed by the time of the latest reading, so you know how current the numbers are.
Reading the tabs
Overview
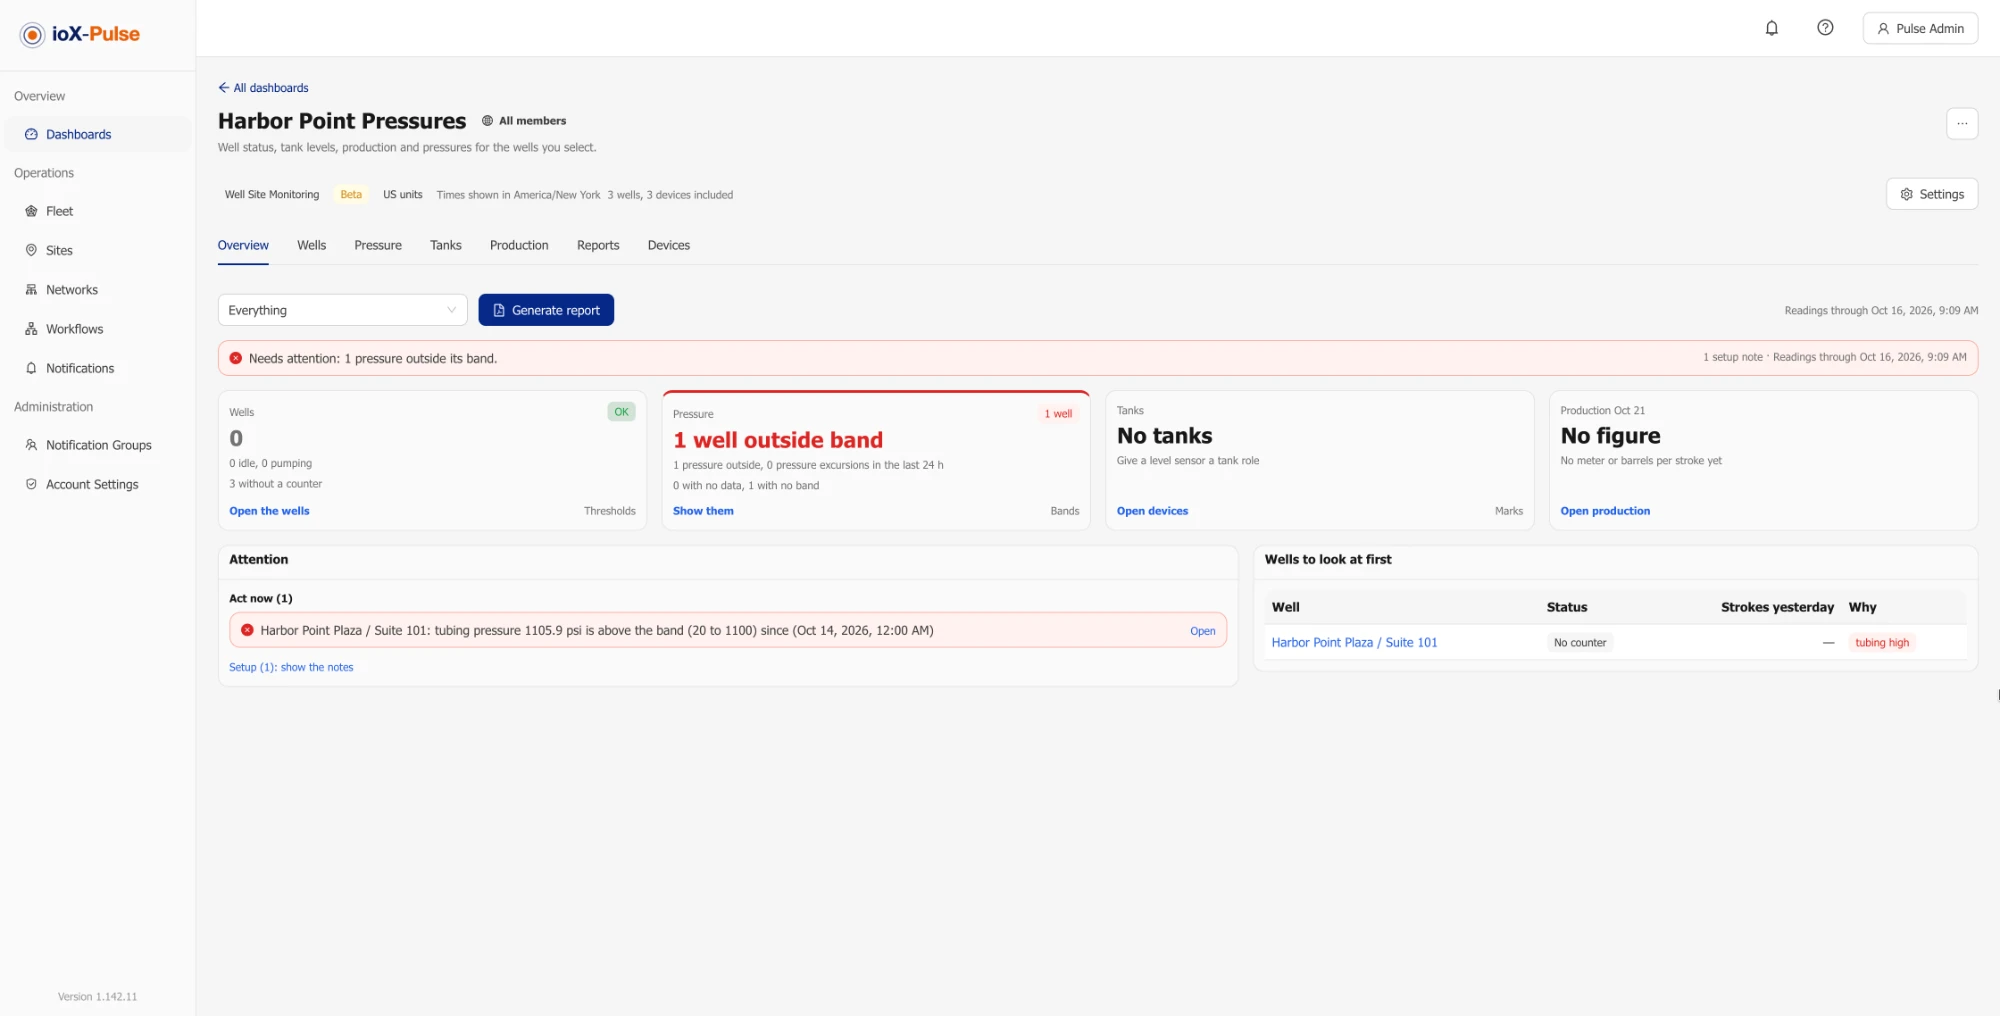
The Overview answers one question first: is anything wrong?
- Four tiles, Wells, Pressure, Tanks and Production. Each shows OK or the number of issues as its tag (2 issues), the number of things wrong as its headline, and two lines of detail. The main link opens the tab filtered to exactly the things counted: Show the wells opens Wells with the down and no-data wells, Show them opens Pressure with the wells outside their band or with an excursion, Show the tanks opens Tanks with the high, low, falling fast and rising fast tanks, and the underperforming yesterday line on Production opens Wells narrowed to those wells. The small link beside it (Thresholds, Bands, Marks) opens that section of the settings. The Pressure tile counts wells in its headline and pressures in its detail lines, because a well can have up to three pressures.
- Attention, in three groups: Act now, Check and Setup. Clicking a reading row opens that well or tank; a setup row keeps its Fix link. Setup is folded behind show the notes while the other groups have rows, so a missing band or a device in no site never hides a well that is down.
- Wells to look at first: the wells that are down, not reporting, underperforming, off their expected run time, outside a pressure band or with a pressure excursion, each with a Why tag; the well name opens it.
The filtered views are in the page address, so a link to a tile's result reproduces it and the browser's Back returns to the Overview.
Wells
One row per well with its status and since when, strokes yesterday against the well's baseline, run time, yesterday's production per source, and each pressure with its band. The status filter takes any number of statuses. Click a well to open it: strokes per day, each pressure over 7 or 30 days with its band drawn and the hours outside the band per day, production per day per source, and the well's settings.
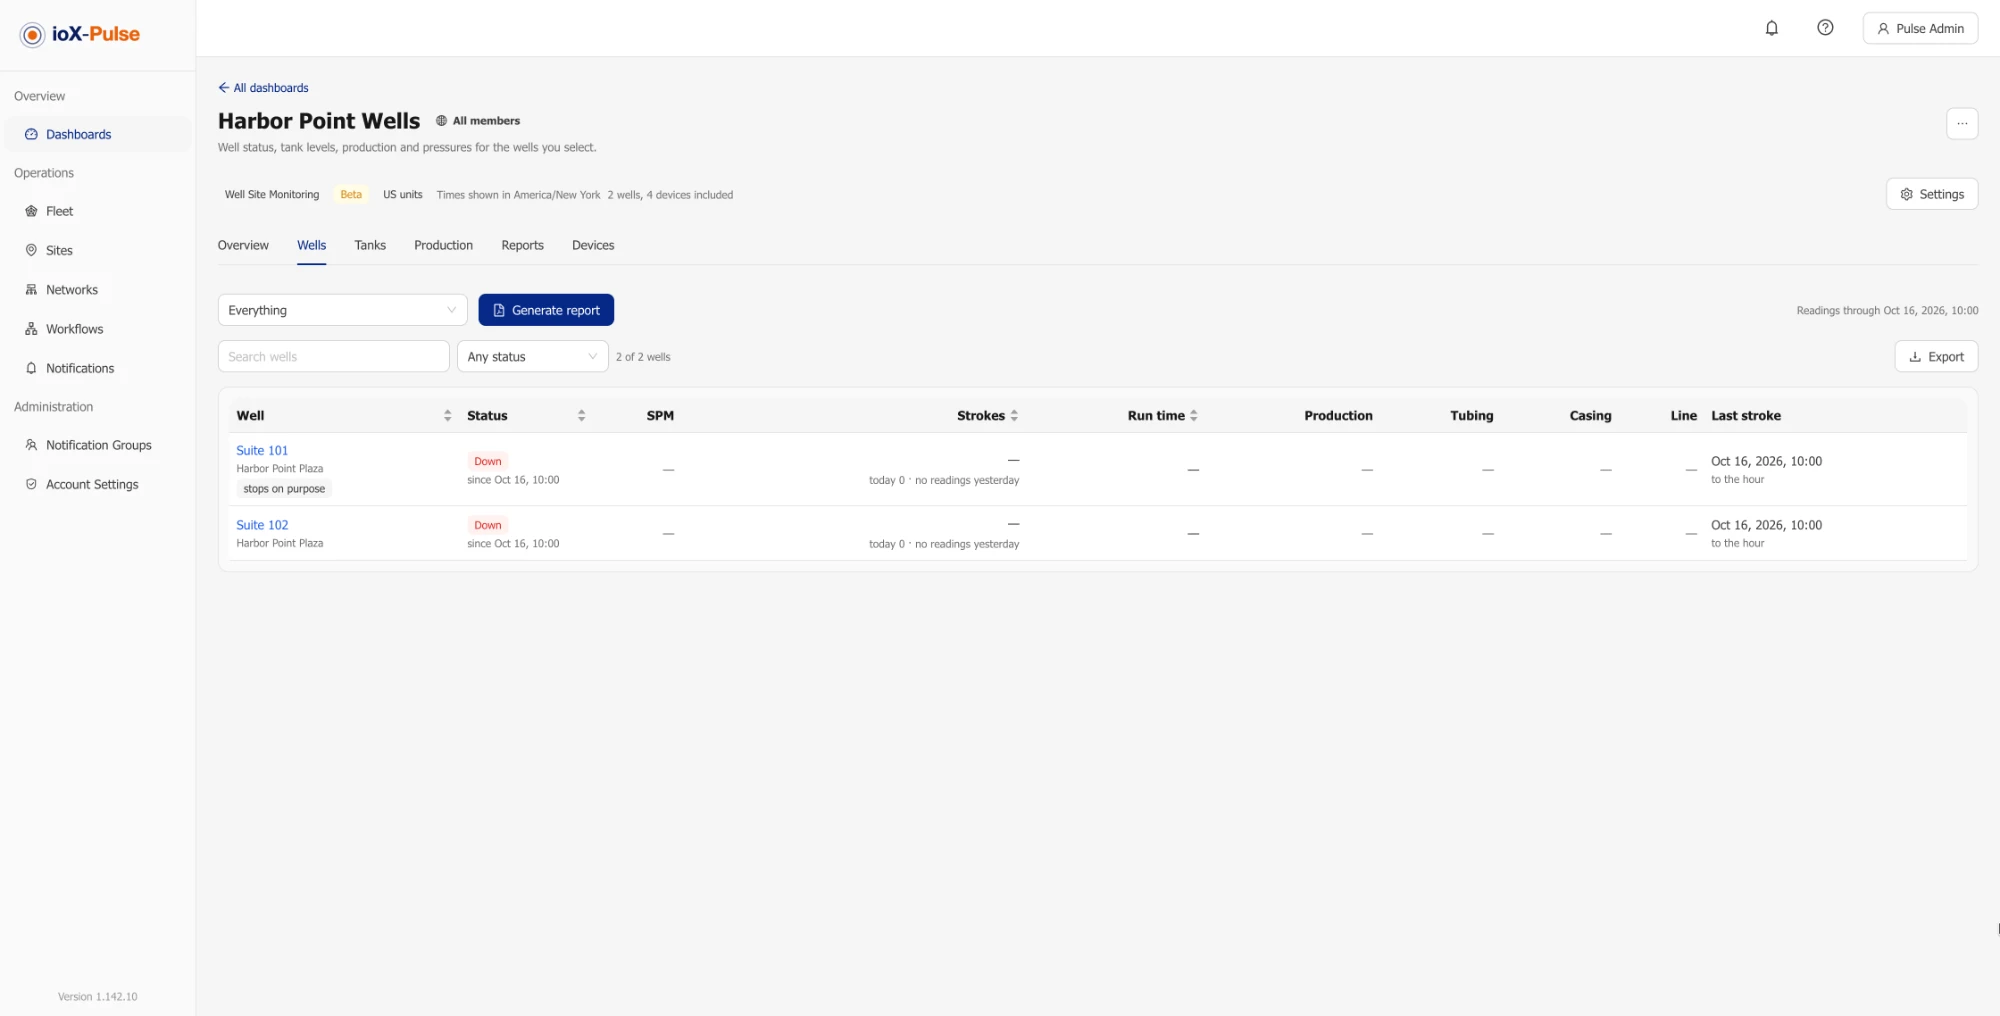
| Status | Meaning |
|---|---|
| Pumping | A stroke was counted inside the well's down-after window. |
| Idle | The well is marked as stopping on purpose (a pump-off controller or a timer) and is between runs. |
| Down | No stroke for longer than the well's down-after minutes, while the stroke counter still reports. |
| No data | The stroke counter has not reported within its threshold, so the well is unknown, not down. |
| No counter | The well has pressure sensors but no stroke counter, so it has no status and no strokes. |
Baseline and underperforming. Yesterday's strokes are compared with the average of the days before it (7 by default, at least 3 days of readings). A well more than the threshold below its baseline (25 percent by default) is underperforming. A well that stops on purpose can also have an expected run time; a day far from it is flagged as run time off.
Pressure
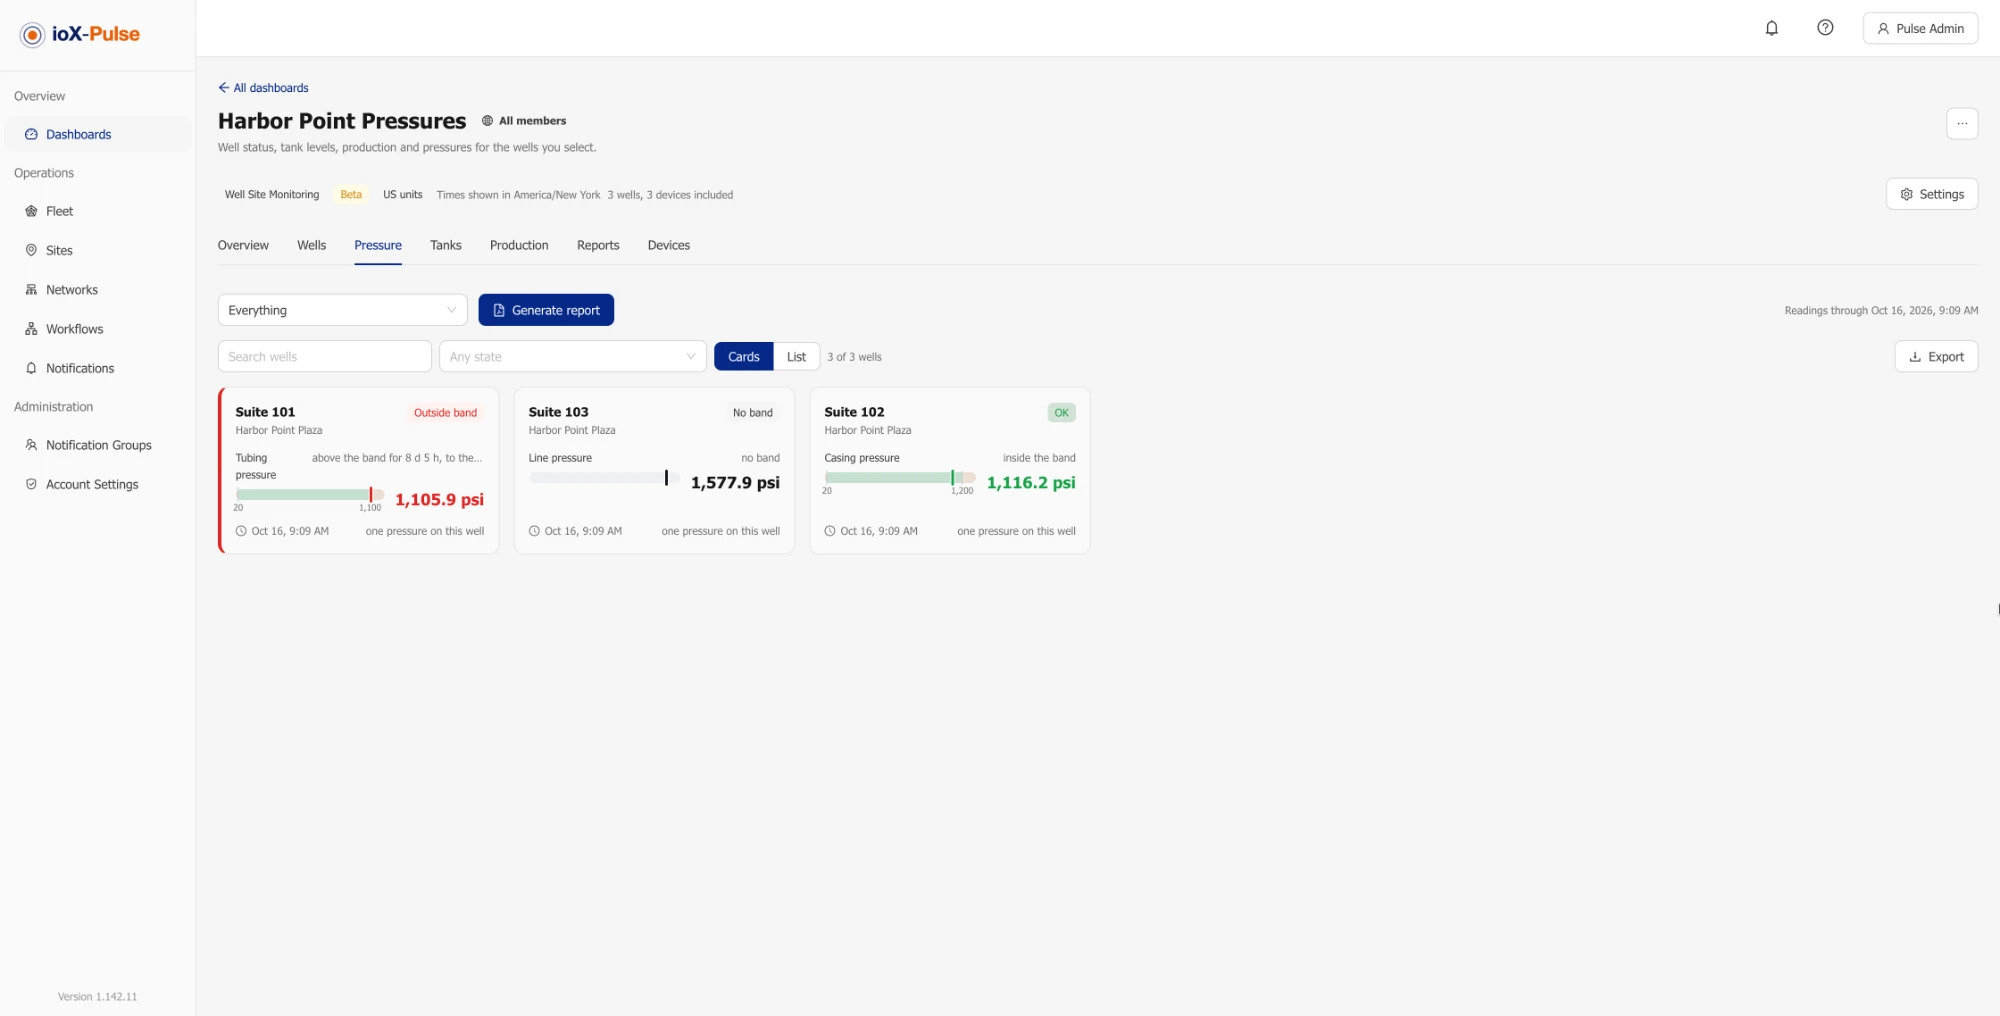
One card per well that has a tubing, casing or line pressure, sorted so the wells that need a look come first (or in the order you set on the Devices tab). Each pressure on the well is a band bar: the band as a green zone with its low and high, the zones beyond it tinted, the last 24 hours as a thin range, and the current reading as a pointer with its value in the state's color. Under each bar, one line says why: how long the reading has been above or below the band, the highest or lowest reading of the last 24 hours when the pressure is back inside, when the sensor last reported, or no band. A small chart shows the last 48 hours per pressure, the casing minus tubing differential sits in the footer, and a note says which device is read when two share a role. Switch to List for hundreds of wells: each pressure as a compact bar, the state, since when, the hours outside yesterday for the worst pressure, and the last reading. Click a card or a row to open the well at its pressures: each pressure over 7 or 30 days with the band drawn, the zones beyond it shaded, the breach tinted, and a strip of hours outside per day, with Edit bands for those who can change settings.
| State | Meaning |
|---|---|
| Outside band | The current reading is outside the band set for the well. |
| Excursion | Inside the band now, but a reading in the last 24 hours was outside it. |
| No data | The sensor has not reported within its threshold, whatever its last value was. |
| No band | No low or high set for this pressure, so nothing can be an exception. |
| OK | Inside the band now and for the last 24 hours. |
A well's state is its worst pressure, in that order; the state filter takes any number of states. A pressure with a band on one side only is judged on that side.
Excursion has two definitions, one per surface. On the dashboard an excursion is the last 24 hours: inside now, outside at some point since this time yesterday. On a report, in its Excel file and in the daily morning email, an excursion is the period: inside at the moment the report was generated, and outside for at least one hour of the days the report covers. The method page of every report states both.
Hours outside counts the hours of a day in which any reading was outside the band, to the hour, up to 24. It is shown per day in the well's pressures, in the Wells and Pressure exports, and in the reports.
Tanks
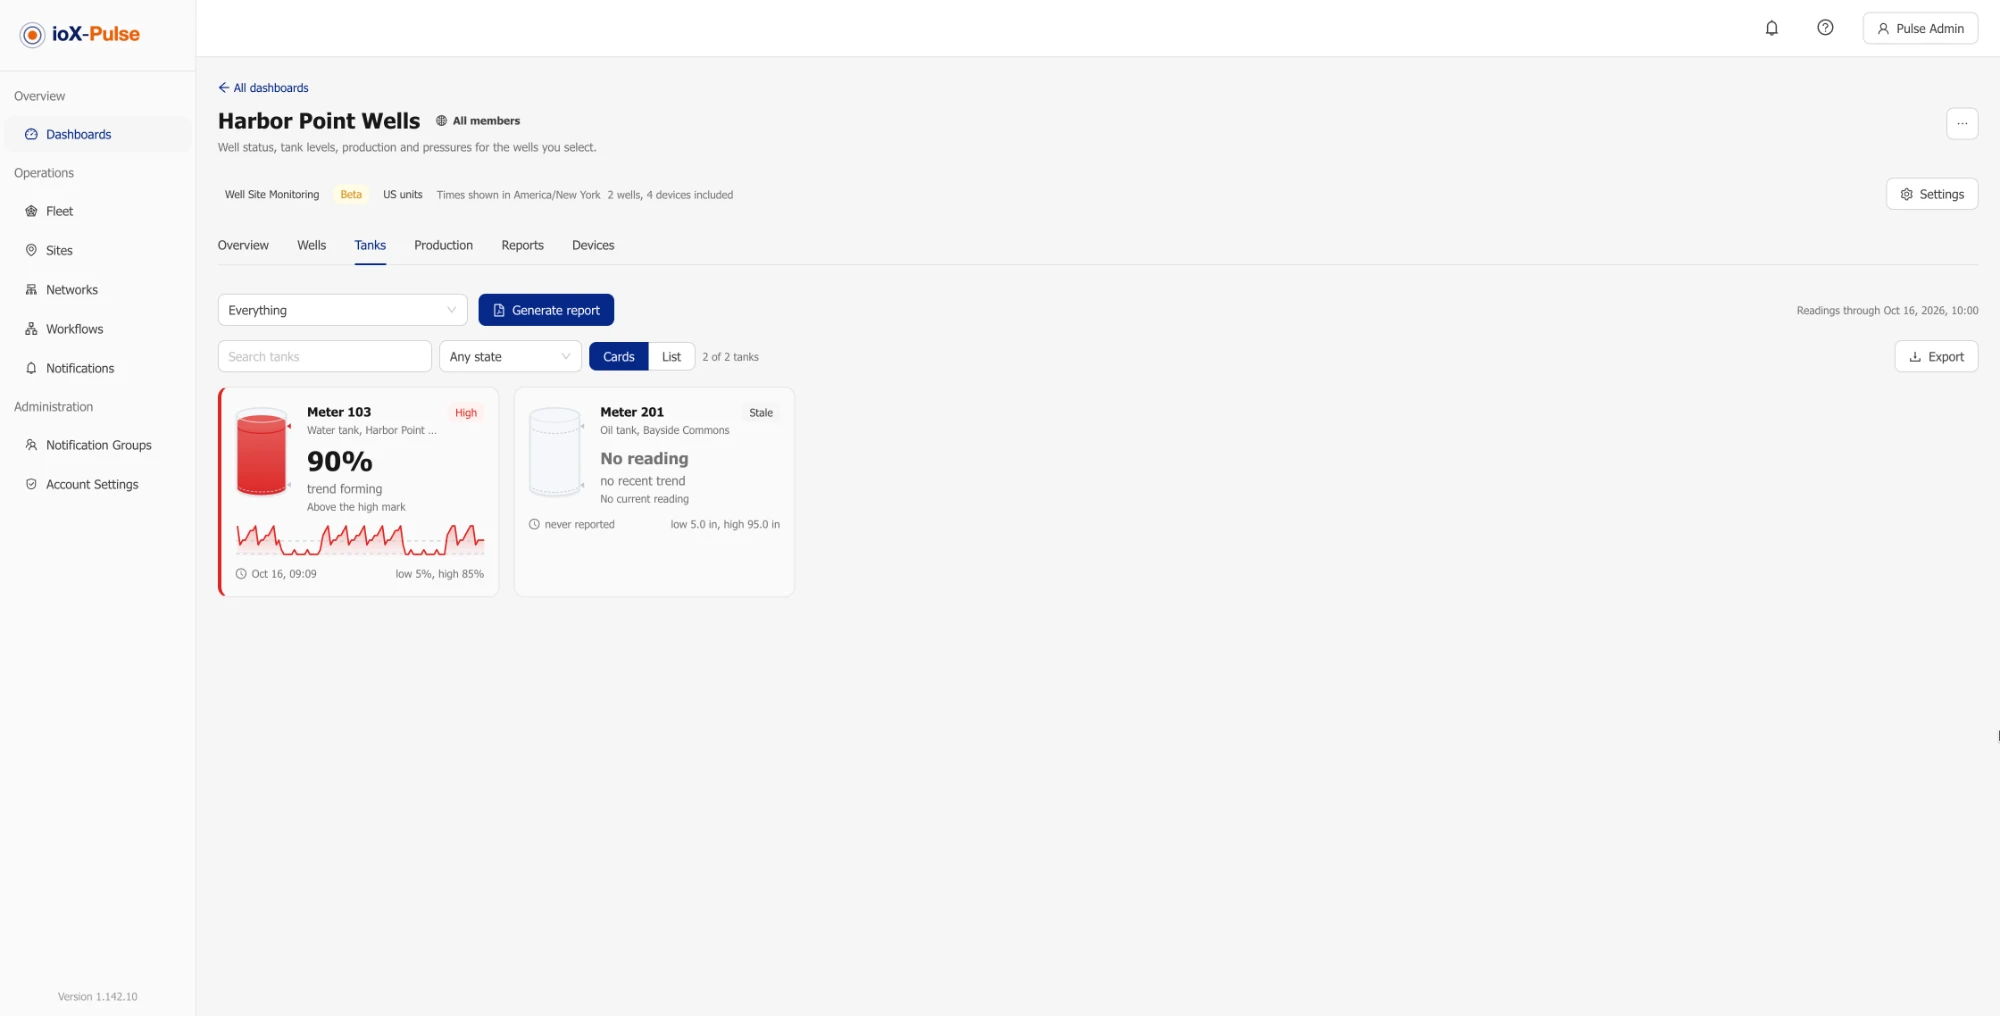
One card per tank, sorted so the tanks that need a look come first (or in the order you set on the Devices tab): a tank figure with its level and marks, the level in the tank's own unit, the trend per day, the time to a mark at the current trend, the last two days as a small chart, and the last reading. Switch to List for hundreds of tanks. Click a tank to open it: the level over 7 or 30 days with the zones beyond the marks shaded, the emptied events, and the facts.
| State | Meaning |
|---|---|
| High | At or above the tank's high mark. |
| Low | At or below the tank's low mark. |
| Falling fast | Dropping faster than the threshold with no emptied event: a leak, a transfer or an open valve. |
| Rising fast | Filling faster than the threshold. |
| Stale | No reading within the device's threshold; the level shown is the last one received. |
| OK | Between the marks and trending normally. |
A tank near a mark reaches its high or low mark within 24 hours at the current trend. An emptied event is a drop of at least the dashboard's threshold between two readings, such as a haul or a transfer; the trend is worked out with those drops added back, so a haul does not read as a leak.
The dashboard knows a tank's level, not its size: no height, capacity or barrels are assumed. Marks are in the tank's own unit.
Production
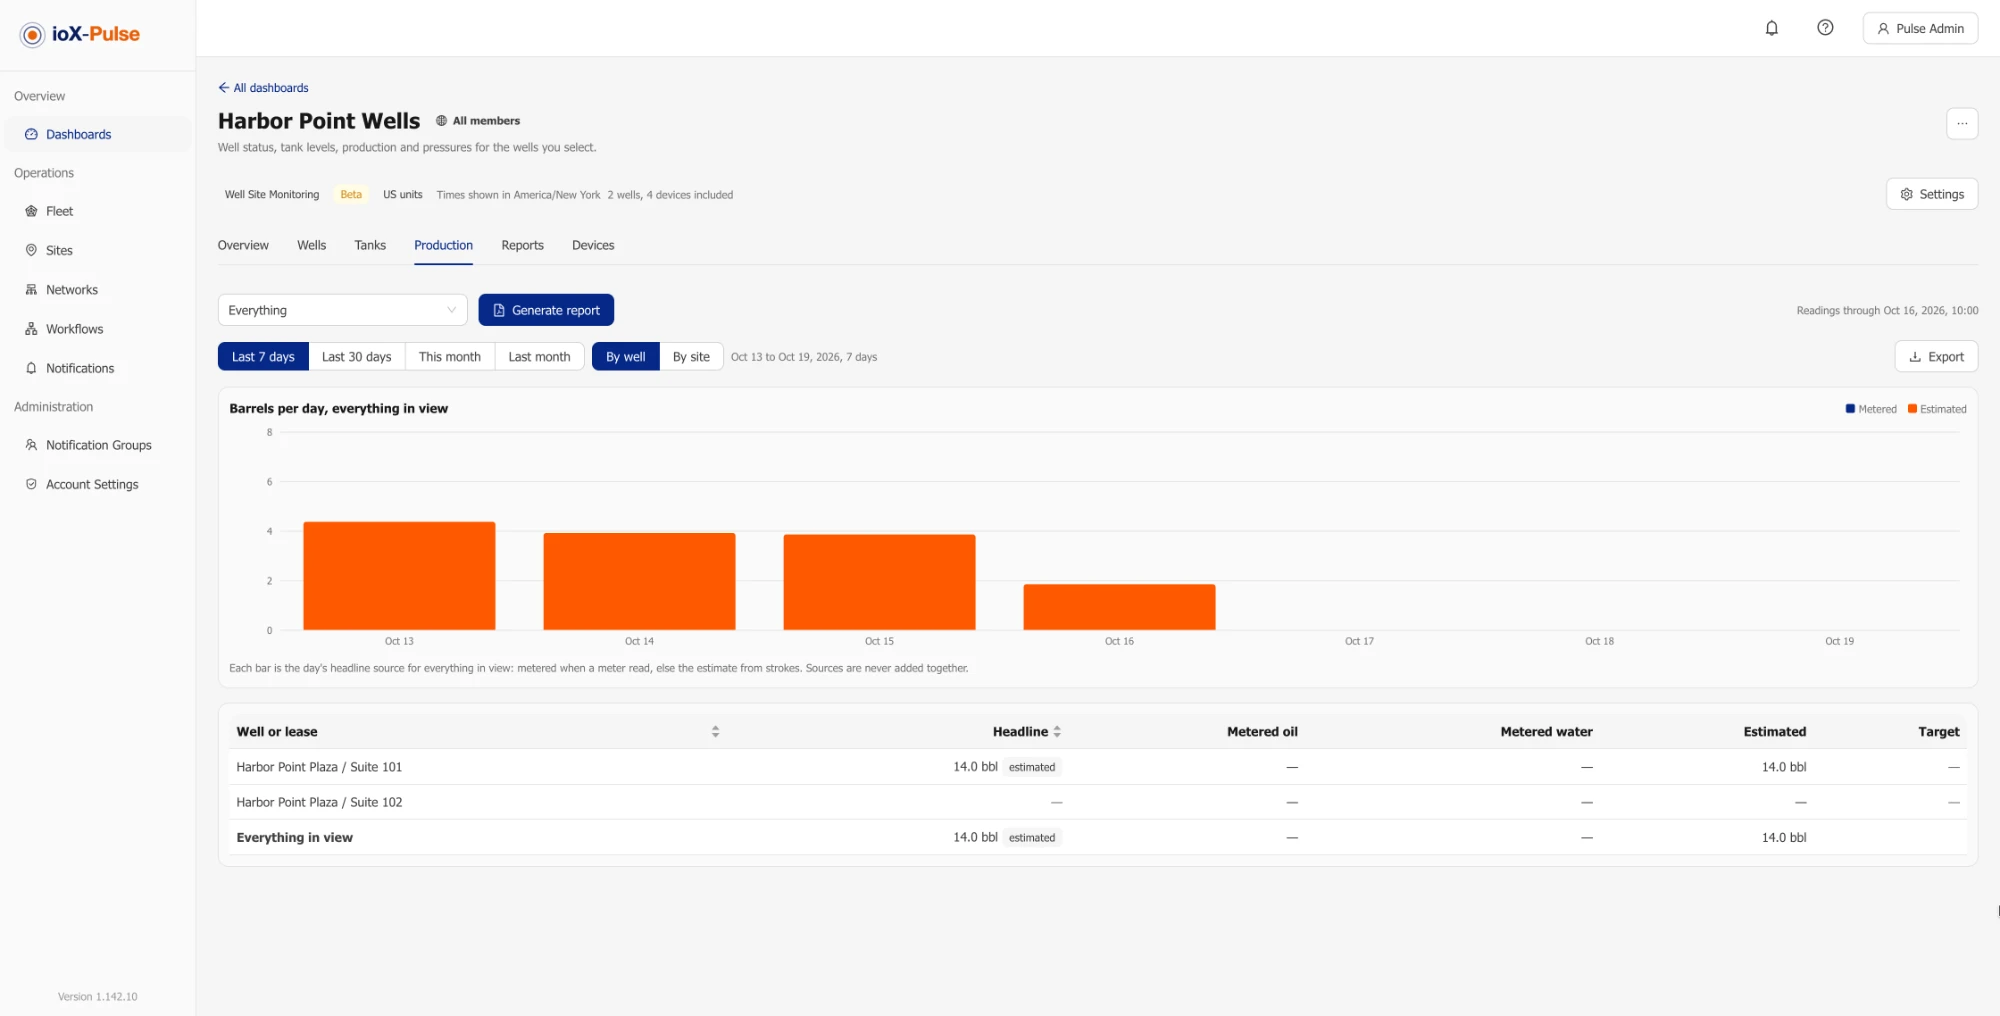
Barrels per day for the period, by well or by site, with one color per source:
- Metered: an oil meter's increase over the day, shown only on days the meter read; metered water is listed beside it.
- Estimated: gross fluid from strokes times the barrels per stroke entered for the well. It is not oil.
The headline for a day is the first available source in that order; sources are never added together. A target in barrels per day can be set per well and is shown against the period.
Reports
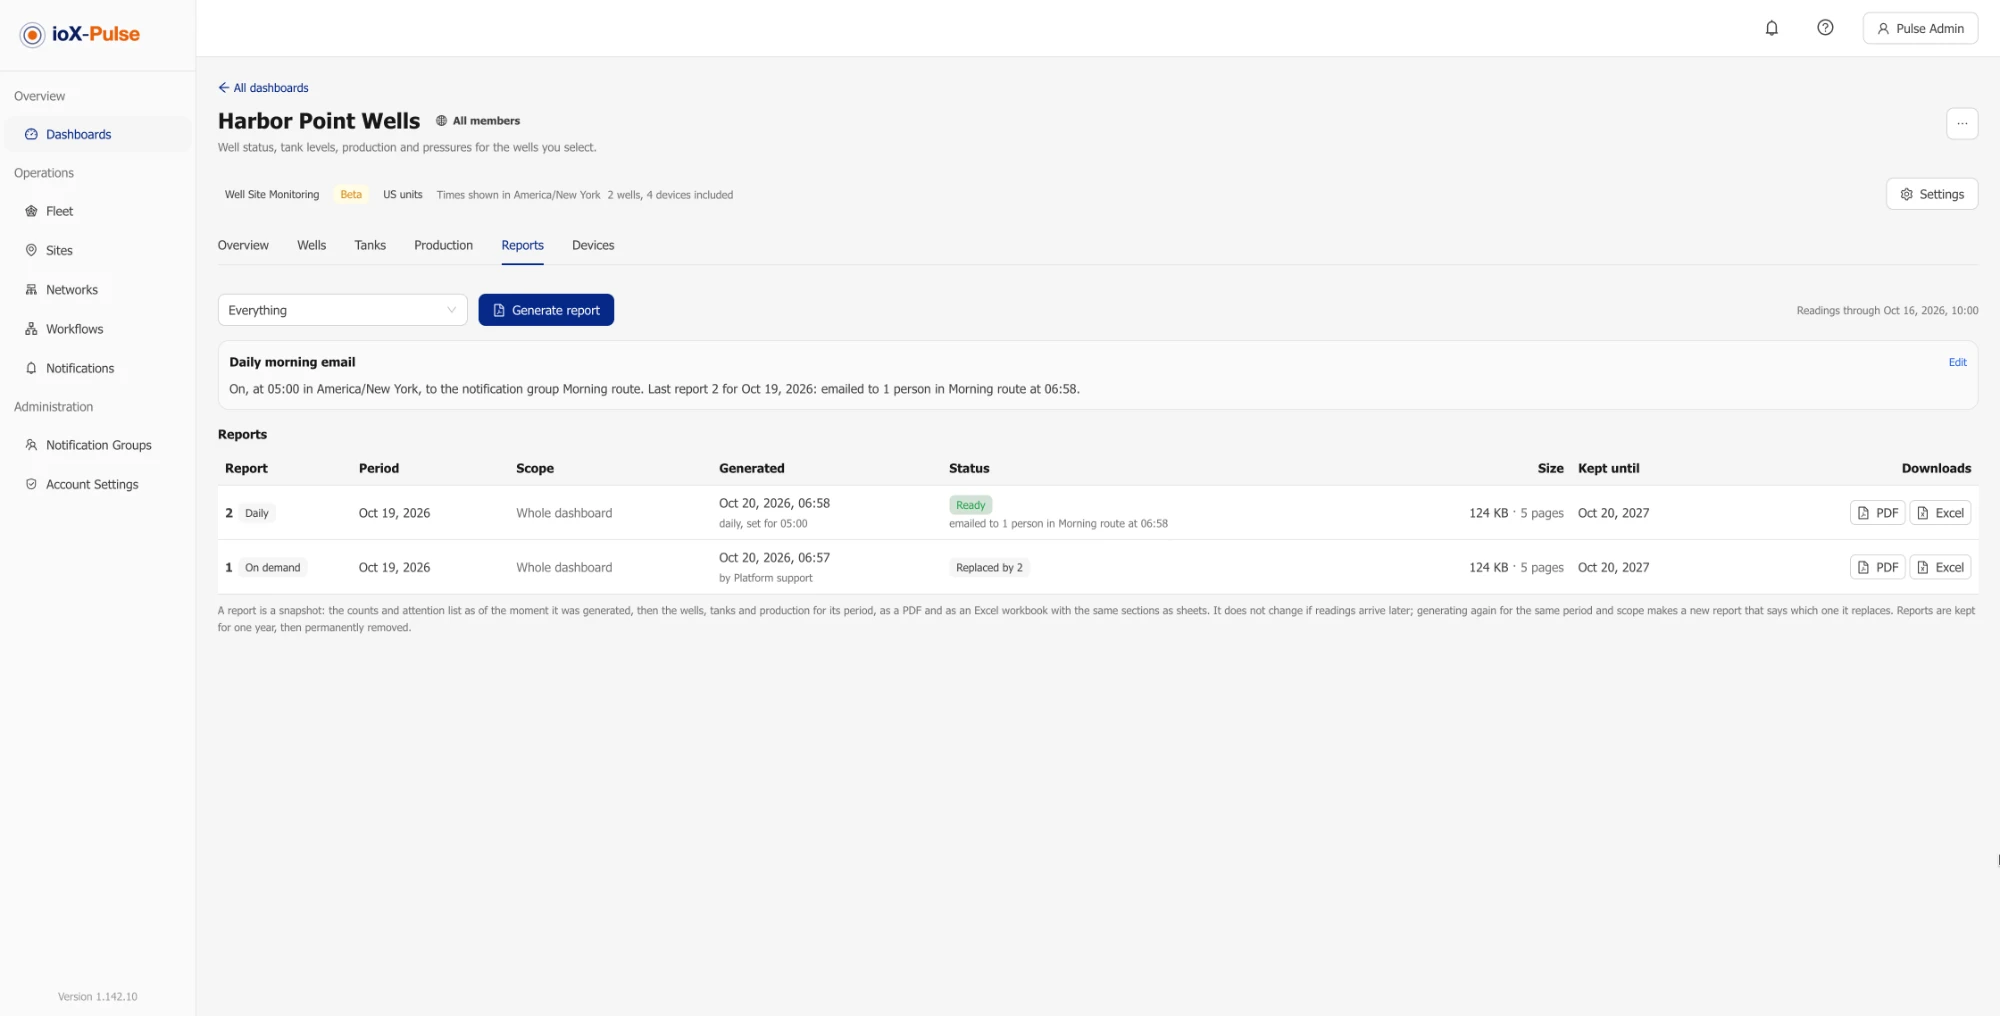
The reports generated for this dashboard and the daily morning email in brief; see Generating a report and The daily morning email.
Devices
Every included device with its site, its role and when it last reported; the place to assign roles. A device with a role but no site is marked Not in a site, and a second device with the same role in one site is marked Shares the ... role, naming the device the dashboard reads; both notes update as soon as a role is chosen, before it is saved. While either case exists a banner counts them and links to How wells are modeled.
If you can change settings, the first column is a drag handle. Drag the devices into the order you work in (the order you drive the lease, say) and the order saves as you drop: the Pressure and Tanks cards then follow it, a tank card where its device sits and a well card where its first device sits, and the List views follow the same order until you sort a column. Until you reorder, the cards out of range come first; Reset order brings that back. Only one order is in force at a time, so with your own order a card no longer moves when its state changes. A device added later joins the end. Clear the search and any column sort to drag.
Settings
Open Settings from the dashboard. Every save makes a new version of the configuration.
- General: the dashboard's time zone and clock format, and the PDF report logo: upload a PNG or JPEG (up to 500 KB and 2000 px; about 600 x 200 px works best) and it prints top left on the first page of every PDF this dashboard generates, on demand and in the daily email. Excel and CSV exports never carry it; without a logo the reports show only the "Powered by" mark in the footer.
- Devices: the selection and the roles.
- Wells: per well, whether it stops on purpose, its expected run time, its own down-after minutes, its barrels per stroke (entered, or computed from plunger diameter, stroke length and an efficiency you calibrate) and a target in barrels per day.
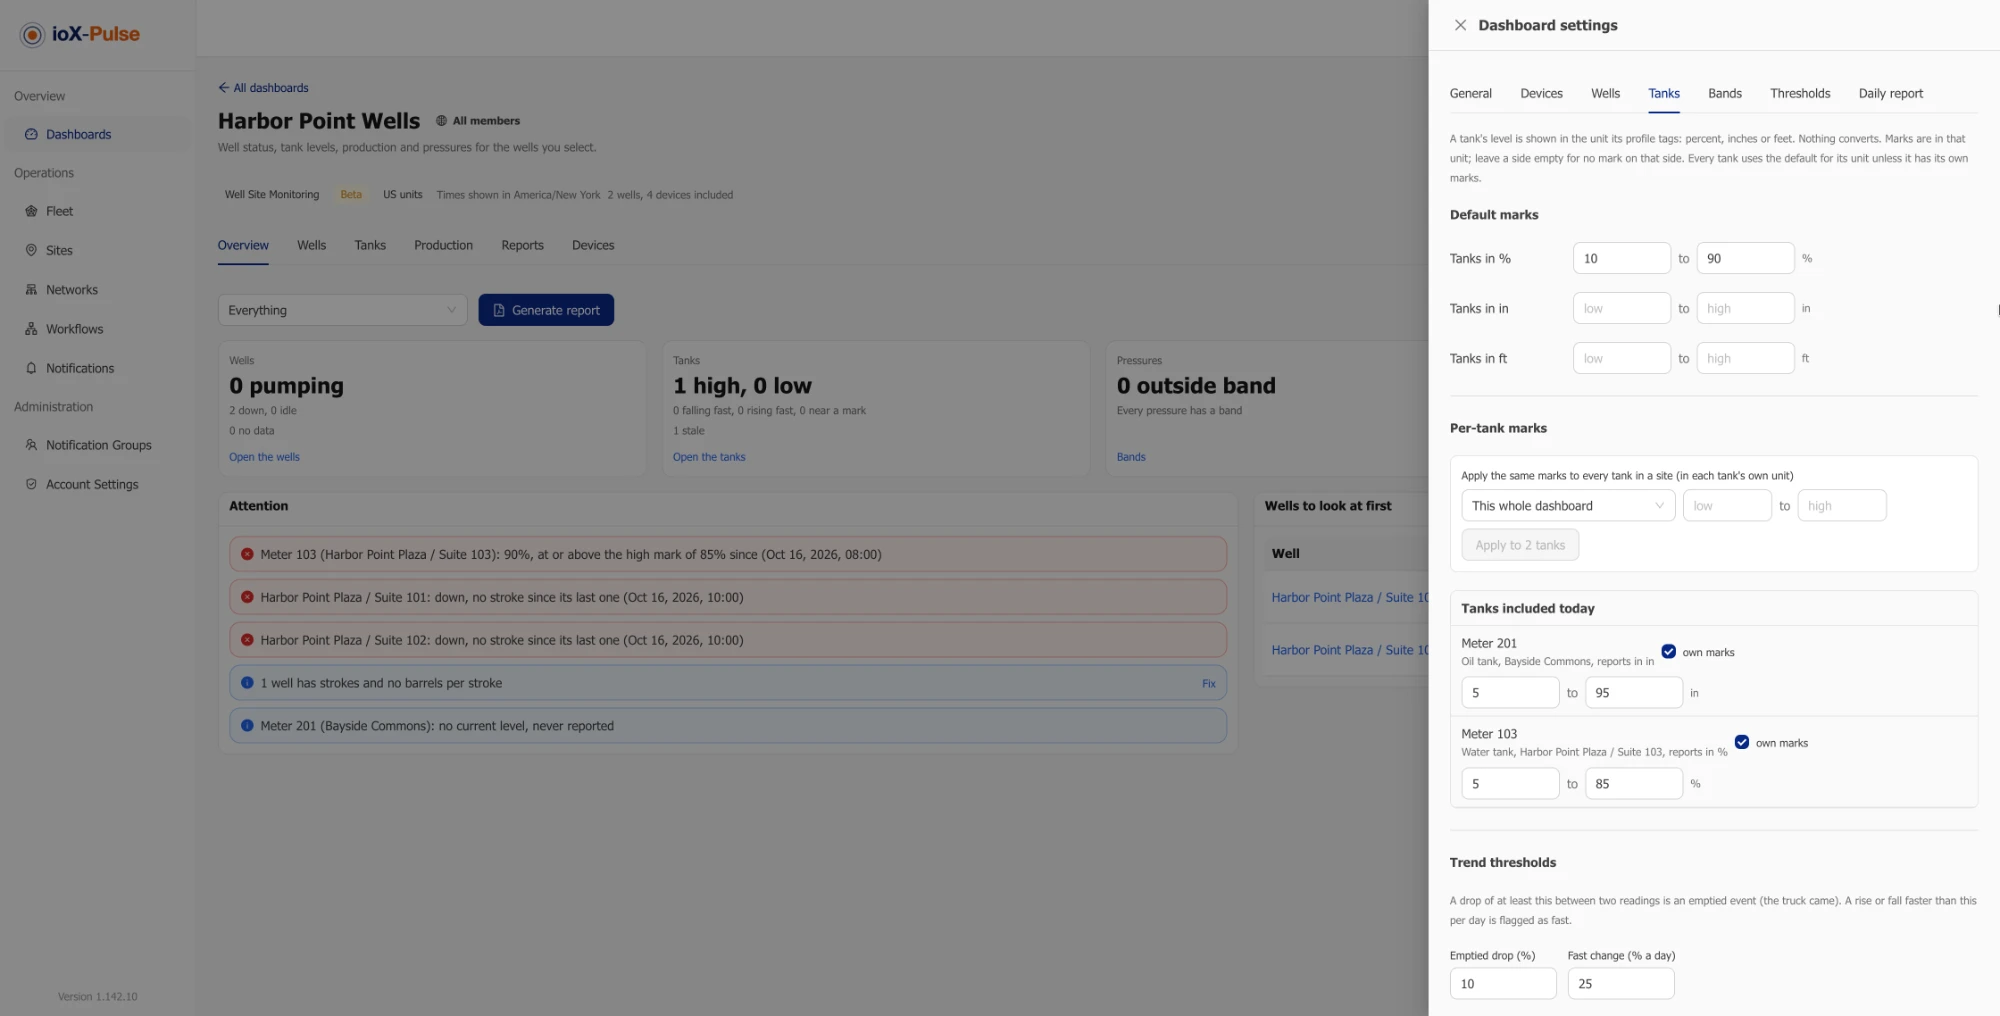
- Tanks: the low and high marks, as a default per unit (percent, inches, feet) and per tank where a tank needs its own; Apply gives the same marks to every tank in a site. Also the emptied event threshold and the falling or rising fast threshold per unit.
- Bands: the pressure band per role (tubing, casing, line) as a default and per well. A reading outside its band is an exception; a pressure that comes back inside after a breach is an excursion; a pressure with no band is counted on the Overview.
- Thresholds: the default down-after minutes (60), the no data threshold (the device's own by default), the baseline days (7) and the underperforming percentage (25).
- Daily report: the morning email on or off, its notification group and the send time.
Exporting a tab
Export on the Wells, Pressure, Tanks and Production tabs downloads the tab with its current filters as CSV or as an Excel workbook. Wells is one row per well per day with strokes, run time, downtime, production per source and each pressure's lowest, average and highest for the day with its hours outside the band; Pressure is one row per well per pressure per day with the lowest, average, highest and last reading, the band, the hours outside, the state now and since when; Tanks is one row per tank per day with the level at the end of the day, the lowest and highest reading, the emptied events and the marks; Production is one row per well or site per day per source. Days are dates, times are in the dashboard's time zone, numbers are numbers.
Generating a report
Click Generate report beside the site filter. Choose the period, yesterday, the last 7 days, the last 30 days or a custom range of whole days up to 92, and confirm; the scope is whatever the site filter shows. The report is prepared in the background, usually in under a minute, and you get an email when it is ready. It then appears on the Reports tab with two downloads:
- PDF: a cover page with the counts and the attention list as of the moment the report was generated, then the Wells, Pressures, Tanks and Production tables for the period, then a method page that says how every figure was computed. The Pressures table is one row per well per pressure: the reading at generation, the band, the state, since when, the lowest and highest of the period and the hours outside, with the pressures outside their band or in excursion first.
- Excel: the same as sheets, Summary, Attention, Wells, Pressures, Pressures by day, Tanks and Production, with every row. Pressures by day is one row per well per pressure per day.
On a report an excursion is a pressure that is inside its band at generation and was outside for at least one hour of the period; see Pressure for how that differs from the dashboard's last 24 hours.
A report is a snapshot. It does not change if readings arrive later, and generating again for the same period and scope makes a new report that says which one it replaces; the earlier one stays listed. Reports are kept for one year, then permanently removed.
The daily morning email
Under Settings, then Daily report, turn the morning email on, choose a notification group and a send time in the dashboard's time zone. Within a few minutes of that time each day, the dashboard builds yesterday's report for everything it includes and emails the group's email members the counts, including the pressures outside their band and the pressure excursions in the period, and the issues, grouped under Wells, Pressures and Tanks: wells down, underperforming or off their run time, pressures outside their band or with an excursion, and tanks high, low, moving fast or near a mark, each line naming the well or tank, the device, the reading and since when. Devices that are silent or have never reported, and setup notes, are not emailed; they stay on the Overview's Attention panel and in the report files. Up to twelve lines are printed and the rest are counted, and the subject line says how many need attention. The email links the report on the Reports tab; the files need a sign-in. Text message members of the group are not used.
Changes take effect at the next send time: saving after today's send time has passed waits until tomorrow, saving before it still sends today, and turning the email on in the afternoon sends the first report tomorrow morning. A dashboard whose email was already on keeps its schedule. The Settings section and the Reports tab show when the next report goes out, or "due now" when a missed morning is about to catch up.
The Reports tab lists each daily report with when it was built and who it reached: how many people were emailed, how many were skipped because they are limited to a site, and, when nothing went out, why (no group, no email members who can receive it, or email not set up for your workspace).
What the terms mean
| Term | Meaning |
|---|---|
| Stroke | One cycle of the pump jack, as the stroke counter reports it. |
| Down-after | How long a well can go without a stroke, while its counter still reports, before it is down. |
| Stops on purpose | A well on a pump-off controller or a timer; between runs it is idle, not down. |
| Baseline | The average strokes per day over the days before yesterday, used to spot an underperforming well. |
| Band | The low and high pressure a well's tubing, casing or line pressure should stay between. |
| Excursion | A pressure that is inside its band now but was outside it: in the last 24 hours on the dashboard, during the period on a report. |
| Hours outside | The hours of a day in which any reading of a pressure was outside its band, to the hour. |
| Mark | The low or high level a tank should not cross. |
| Emptied event | A drop in a tank's level of at least the threshold between two readings. |
| Metered | Production from an oil or water meter's increase over a day. |
| Estimated | Gross fluid from strokes times barrels per stroke; not oil. |
| Readings through | The time of the latest reading included on the dashboard or in a report. |
Limits and things to know
- Pressures are in psi, tank levels in the unit the profile tags, volumes in 42-gallon barrels, strokes in strokes.
- Readings older than 48 hours are hourly summaries: the first and last reading of each hour with the hour's lowest and highest. Rows and events from those hours are marked to the hour.
- The dashboard reads the hourly summaries your plan keeps, so a period that reaches further back than that shows no data for the missing part.
- A report or an export covers whole days in the dashboard's time zone, up to 92 days.
- The dashboard reports; it does not notify about a single well or tank. For an alert on a silent sensor, a pressure beyond a limit or a tank past a level, use Workflows on the devices themselves.