Tenant Sub-metering dashboard
The Tenant Sub-metering dashboard reports energy and water consumption per tenant, with the cost at the rate you enter, so a property owner or manager can give each tenant a consumption statement with their invoice. You choose the property, the dashboard reads every meter in it, and at the end of a billing cycle you generate one set of statements for every tenant. There are no widgets to place.
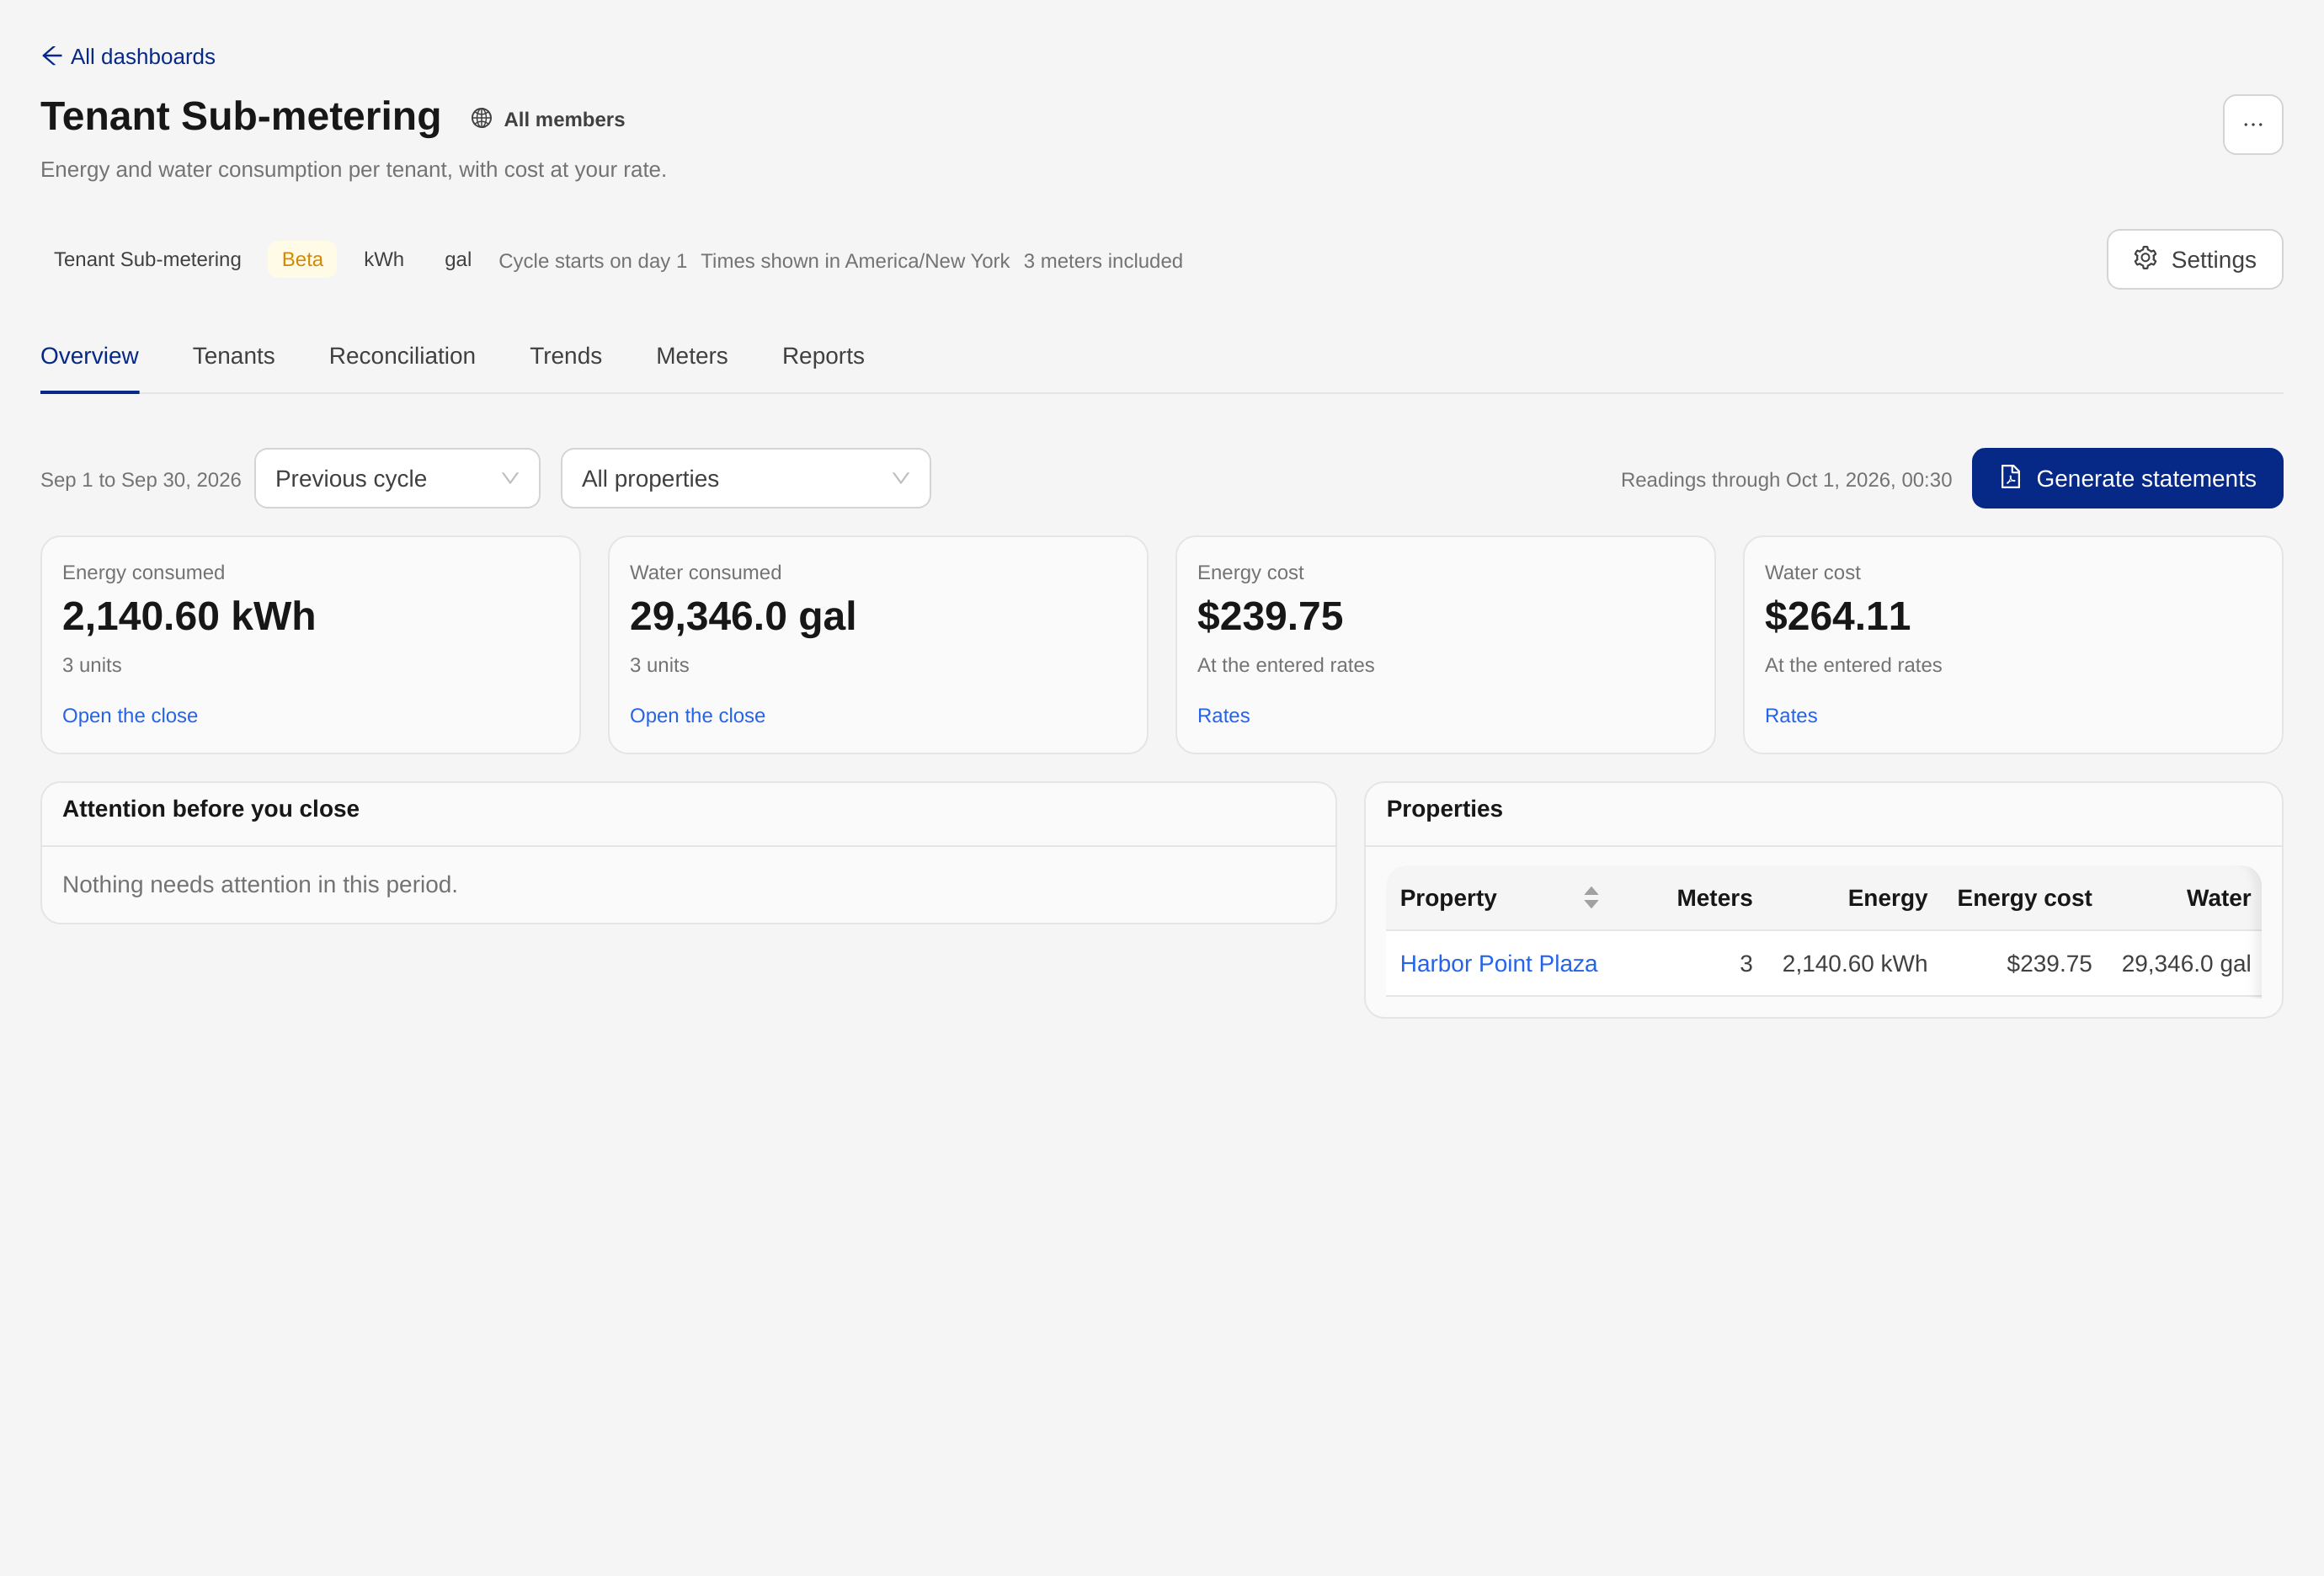
This dashboard is in beta. It is being tested with early users and may change. Please tell your provider what you find.
Do you have this? Dashboard templates are a plan feature, and this one also needs Multi-site, because a tenant on this dashboard is a site. If the New dashboard dialog does not offer a Tenant Sub-metering type, your provider has not enabled it for your workspace. Creating the dashboard, choosing meters, entering rates and bills and changing settings needs Workspace Admin access (or an Operator who has been allowed to manage dashboards). Everyone who can open the dashboard can read it and generate statements.
A statement is not an invoice. The dashboard reports metered consumption and the rate you entered. It does not add taxes, fees, or anything else that belongs on an invoice, and every statement says so in its footer. Your billing system produces the invoice; the statement goes with it.
How tenants are modeled
The dashboard uses your sites:
- A property is a site you tick when choosing meters. A dashboard can cover one property or several.
- A tenant unit is the site a meter sits in. Create a site for each suite, unit or shop under the property, and attach the tenant's meters to it. "Harbor Point Plaza / Suite 101" is a tenant unit; its meters are the tenant's meters. See Sites for how to arrange them.
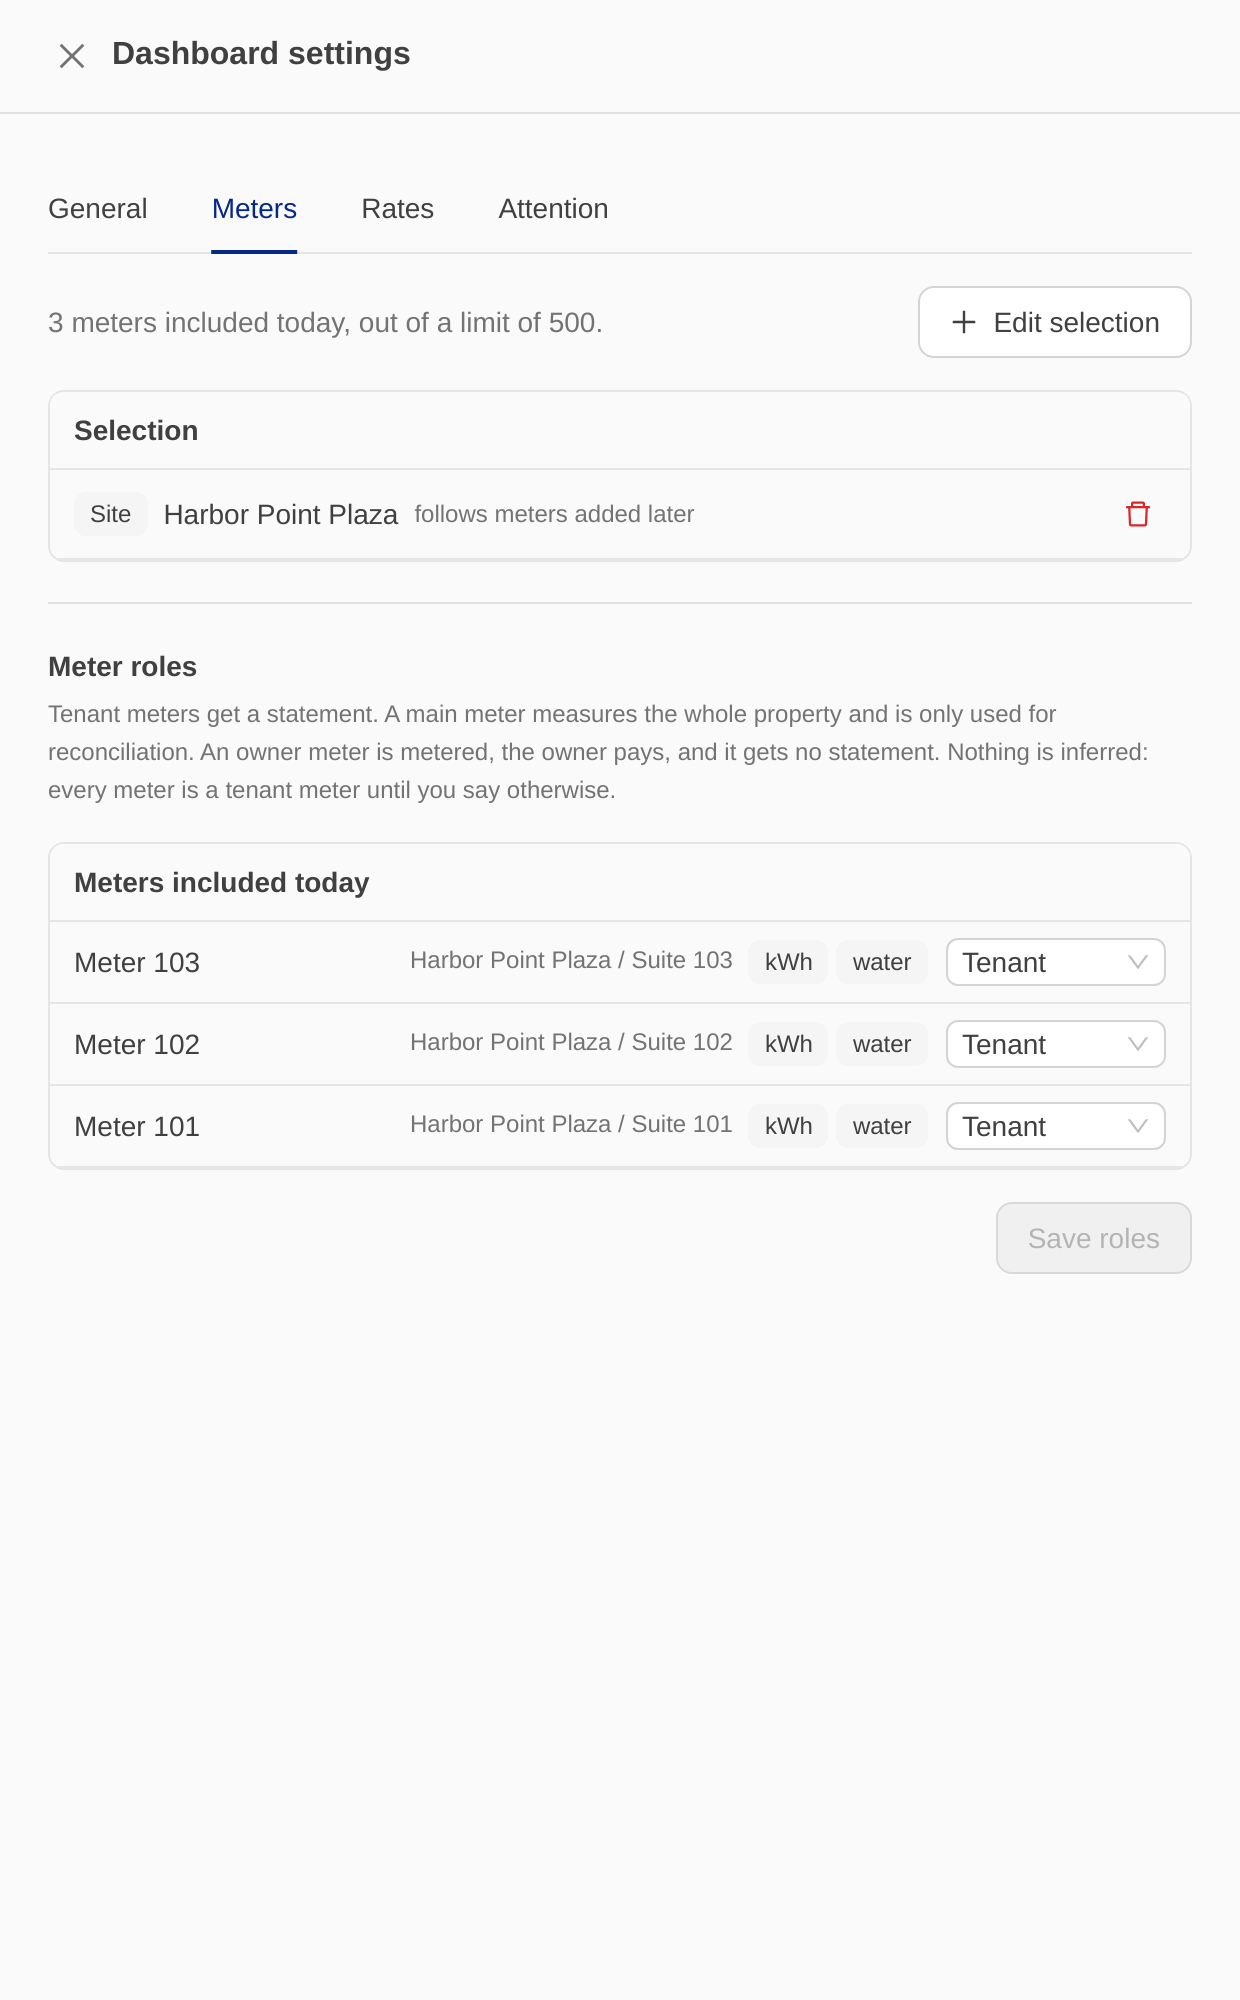
- Every meter is a tenant meter until you say otherwise. A meter that measures the whole property is a main meter; a meter the owner pays for is an owner meter. You set these roles yourself under Settings, then Meters; nothing is inferred from names or positions.
- A network is only a label on this dashboard. A reading is reported under the site its meter was in when it was taken.
A meter attached to the property itself, or to a site that has sites beneath it, is reported under that site rather than a tenant, and the Overview lists it under Attention before you close. A meter in no site at all is reported as Unsited.
Creating the dashboard
- Go to Dashboards in the sidebar and click + New Dashboard.
- Choose the Tenant Sub-metering type and give the dashboard a name.
- Choose the billing cycle start day (1 to 28, so every month has the day), the water unit (gallons or liters), the reporting time zone and the clock format.
- Click Create, then Select meters.
Three of these choices lock once a statement set has been generated: the cycle day, the water unit and the time zone. Statements must stay comparable from one cycle to the next, so to change them, create a new dashboard.
The time zone belongs to the dashboard, not to the person reading it. Every period starts and ends at midnight in that zone, and every time on the dashboard and on a statement is shown in it. Only zones whose midnight falls on a whole hour can be chosen.
Under Settings, then General, you can also upload a PDF report logo: a PNG or JPEG (up to 500 KB and 2000 px; about 600 x 200 px works best) that prints top left on the first page of every statement PDF this dashboard generates. Excel and CSV exports never carry it; without a logo the reports show only the "Powered by" mark in the footer.
Who can do what
| Action | Who |
|---|---|
| Open the dashboard and read every tab | Everyone the dashboard is shared with: Viewers, Operators and Workspace Admins |
| Generate statement sets and download their files | Everyone who can open the dashboard |
| Create the dashboard, choose meters, set roles, enter rates and bills, change settings, delete it | Workspace Admins, and Operators who have been allowed to manage dashboards |
A teammate who is limited to a site sees this dashboard only when everything it includes is inside their site, and can download a statement set only when every site in it is one of theirs. It is all or nothing: the dashboard never shows them a partial picture that could be mistaken for the whole.
Who the dashboard is shared with is set from its ⋯ menu, the same as any other dashboard. A template dashboard cannot be shared by public link.
Choosing meters
Open Settings, then Meters, then Edit selection. Tick a property to include every meter in it and in the sites beneath it, now and in future: a meter attached to one of its sites later is included from its first reading there, and a meter moved out stops being included. Tick a meter on its own to include just that one.
A site or meter inside a ticked property is already included. It shows as ticked, greyed out, with included via the property, and cannot be ticked again. Untick the property to choose meters one by one.
Which meters are eligible
A device is a meter here when its device profile has a field tagged as energy (kWh) or as water in the dashboard's unit, and that field is set to running total or per-report count. A meter with both fields is reported for both. A device whose water field is tagged in the other unit, or whose field has no aggregation kind, cannot be ticked and shows the reason; if such a device sits inside a property you follow, it is listed under Not included on the Meters tab so a hole in your metering cannot go unnoticed.
- A running total field is a meter register: consumption is the end reading minus the start reading.
- A per-report count field is a pulse count: consumption is the sum of the counts reported in the period.
Meter roles
Under Settings, then Meters, each included meter has a role:
- Tenant (the default): reported under its tenant unit and gets a statement.
- Main: measures the whole property. It never forms a tenant unit and gets no statement; it is used on the Reconciliation tab.
- Owner: metered, the owner pays. It is shown in its own group on the Tenants tab and in the close CSV, and gets no statement.
Entering rates
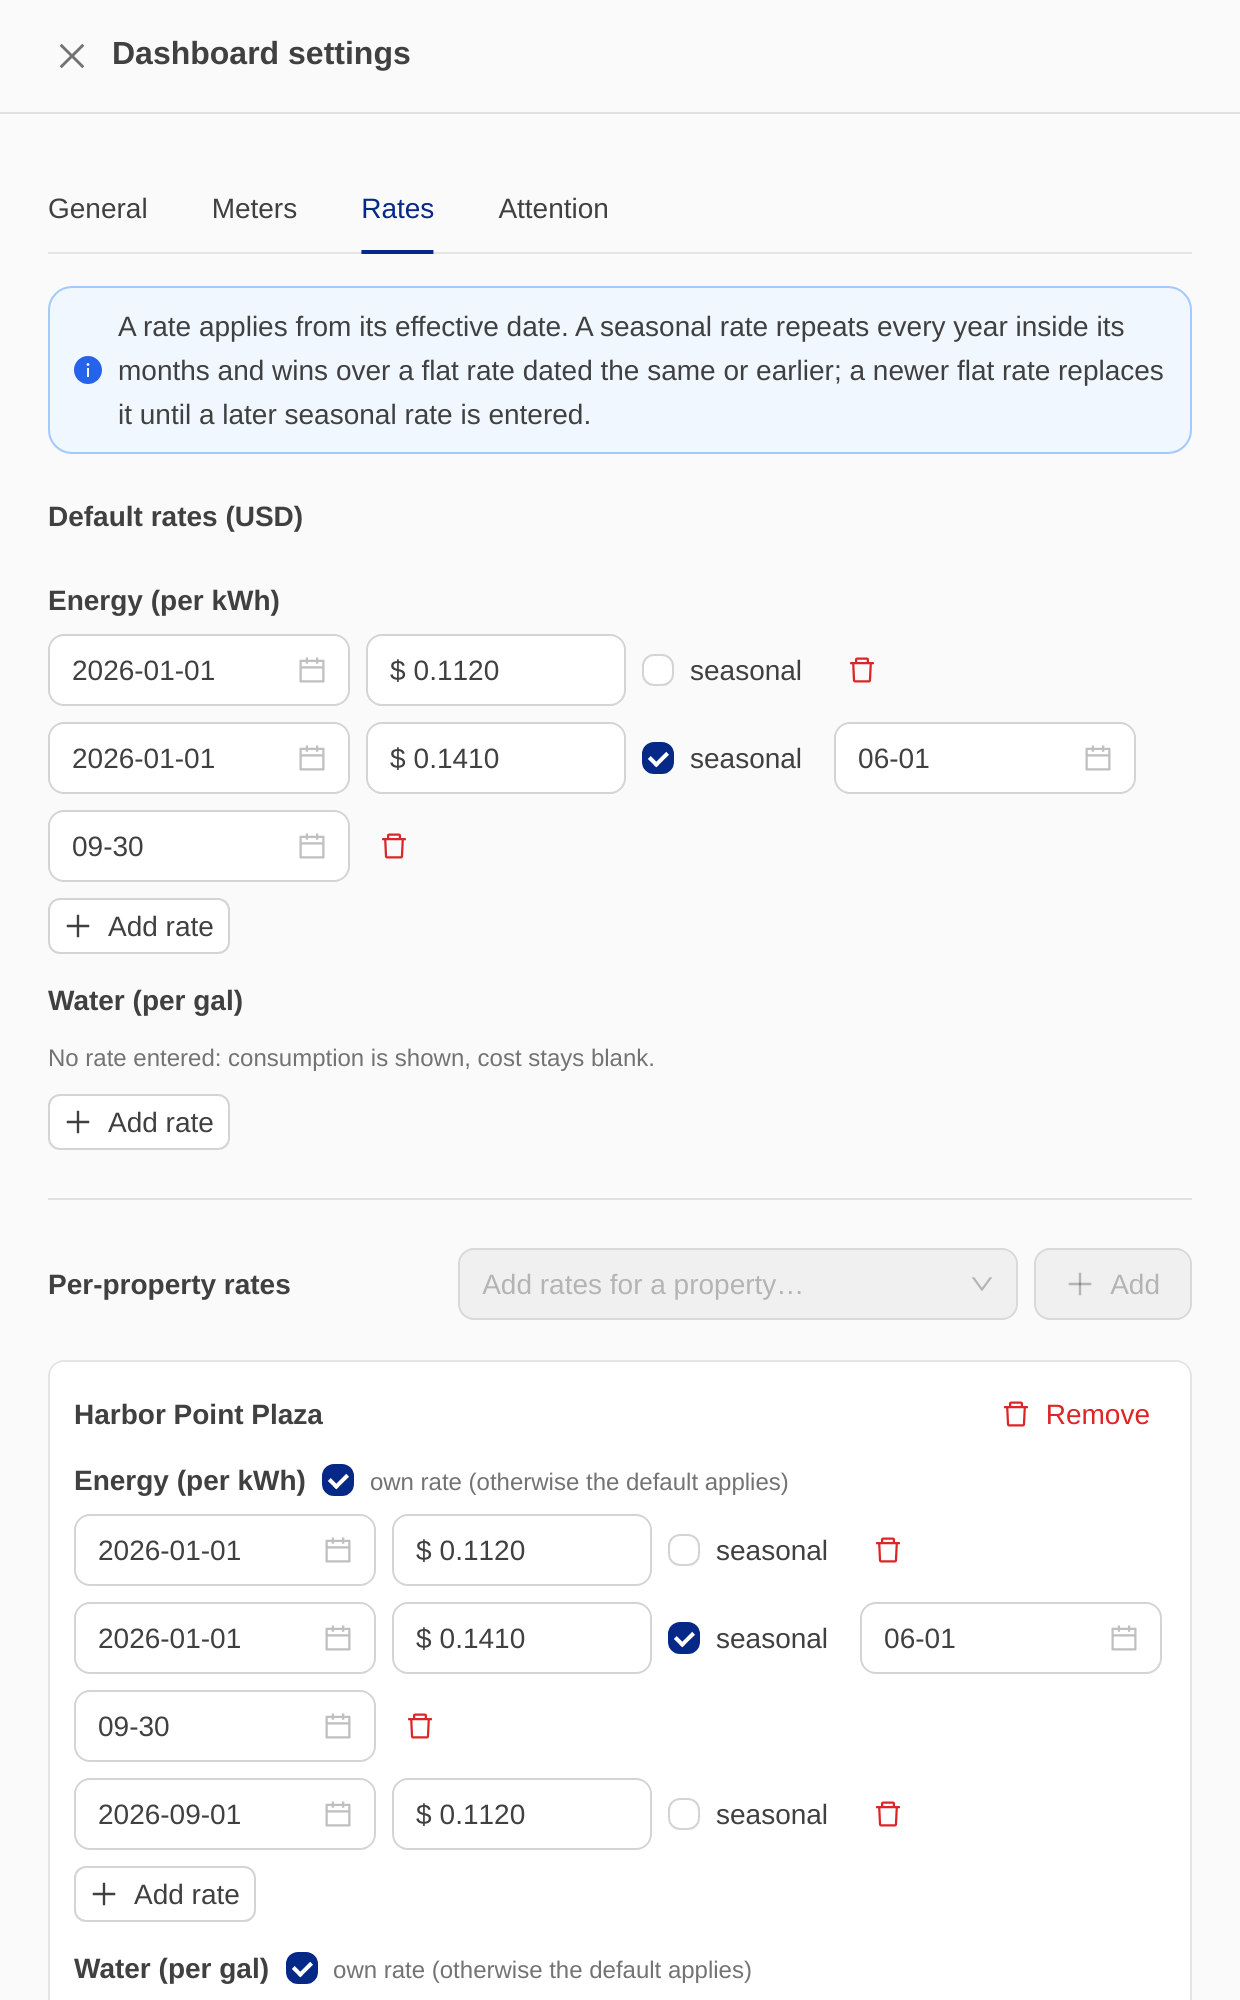
Open Settings, then Rates. Rates are in US dollars per kWh and per gallon or liter.
- Default rates apply to every property. Per-property rates replace them for one property; tick own rate on that property's commodity to use them.
- Every rate has an effective date and applies from that day until a newer rate replaces it.
- A seasonal rate also has a start and end month and day, and repeats every year inside those months. A seasonal rate wins over a flat rate dated the same or earlier; a flat rate entered later replaces it until a later seasonal rate is entered.
- With no rate for some days of a period, consumption is still shown and the cost stays blank, and the Overview says which tenant unit is affected.
When a utility bill tells you what the property really pays, the Reconciliation tab can set the rate from it; see Reconciliation.
Choosing the period
The period control above the tabs offers the current cycle (from the cycle start day to today), the previous cycle, or a custom range of whole days up to 92 days. The line beside it reads Readings through followed by the time of the latest reading in the period, so you know how current the numbers are.
A billing cycle runs from the cycle start day to the day before it next month, in the dashboard's time zone.
Reading the tabs
Overview
Energy and water consumed in the period with their cost at the entered rates, the Attention before you close list, and one row per property with its meters, consumption, cost and attention count. Click a property to filter every tab to it.
Tenants
The close: one row per tenant unit per commodity, with consumption, cost, the change against the previous period and a status. Owner meters are listed in their own group below. Open a row to see the rate applied, each meter's start and end readings with their times (or the pulse count and the number of reports), and a chart of daily usage.
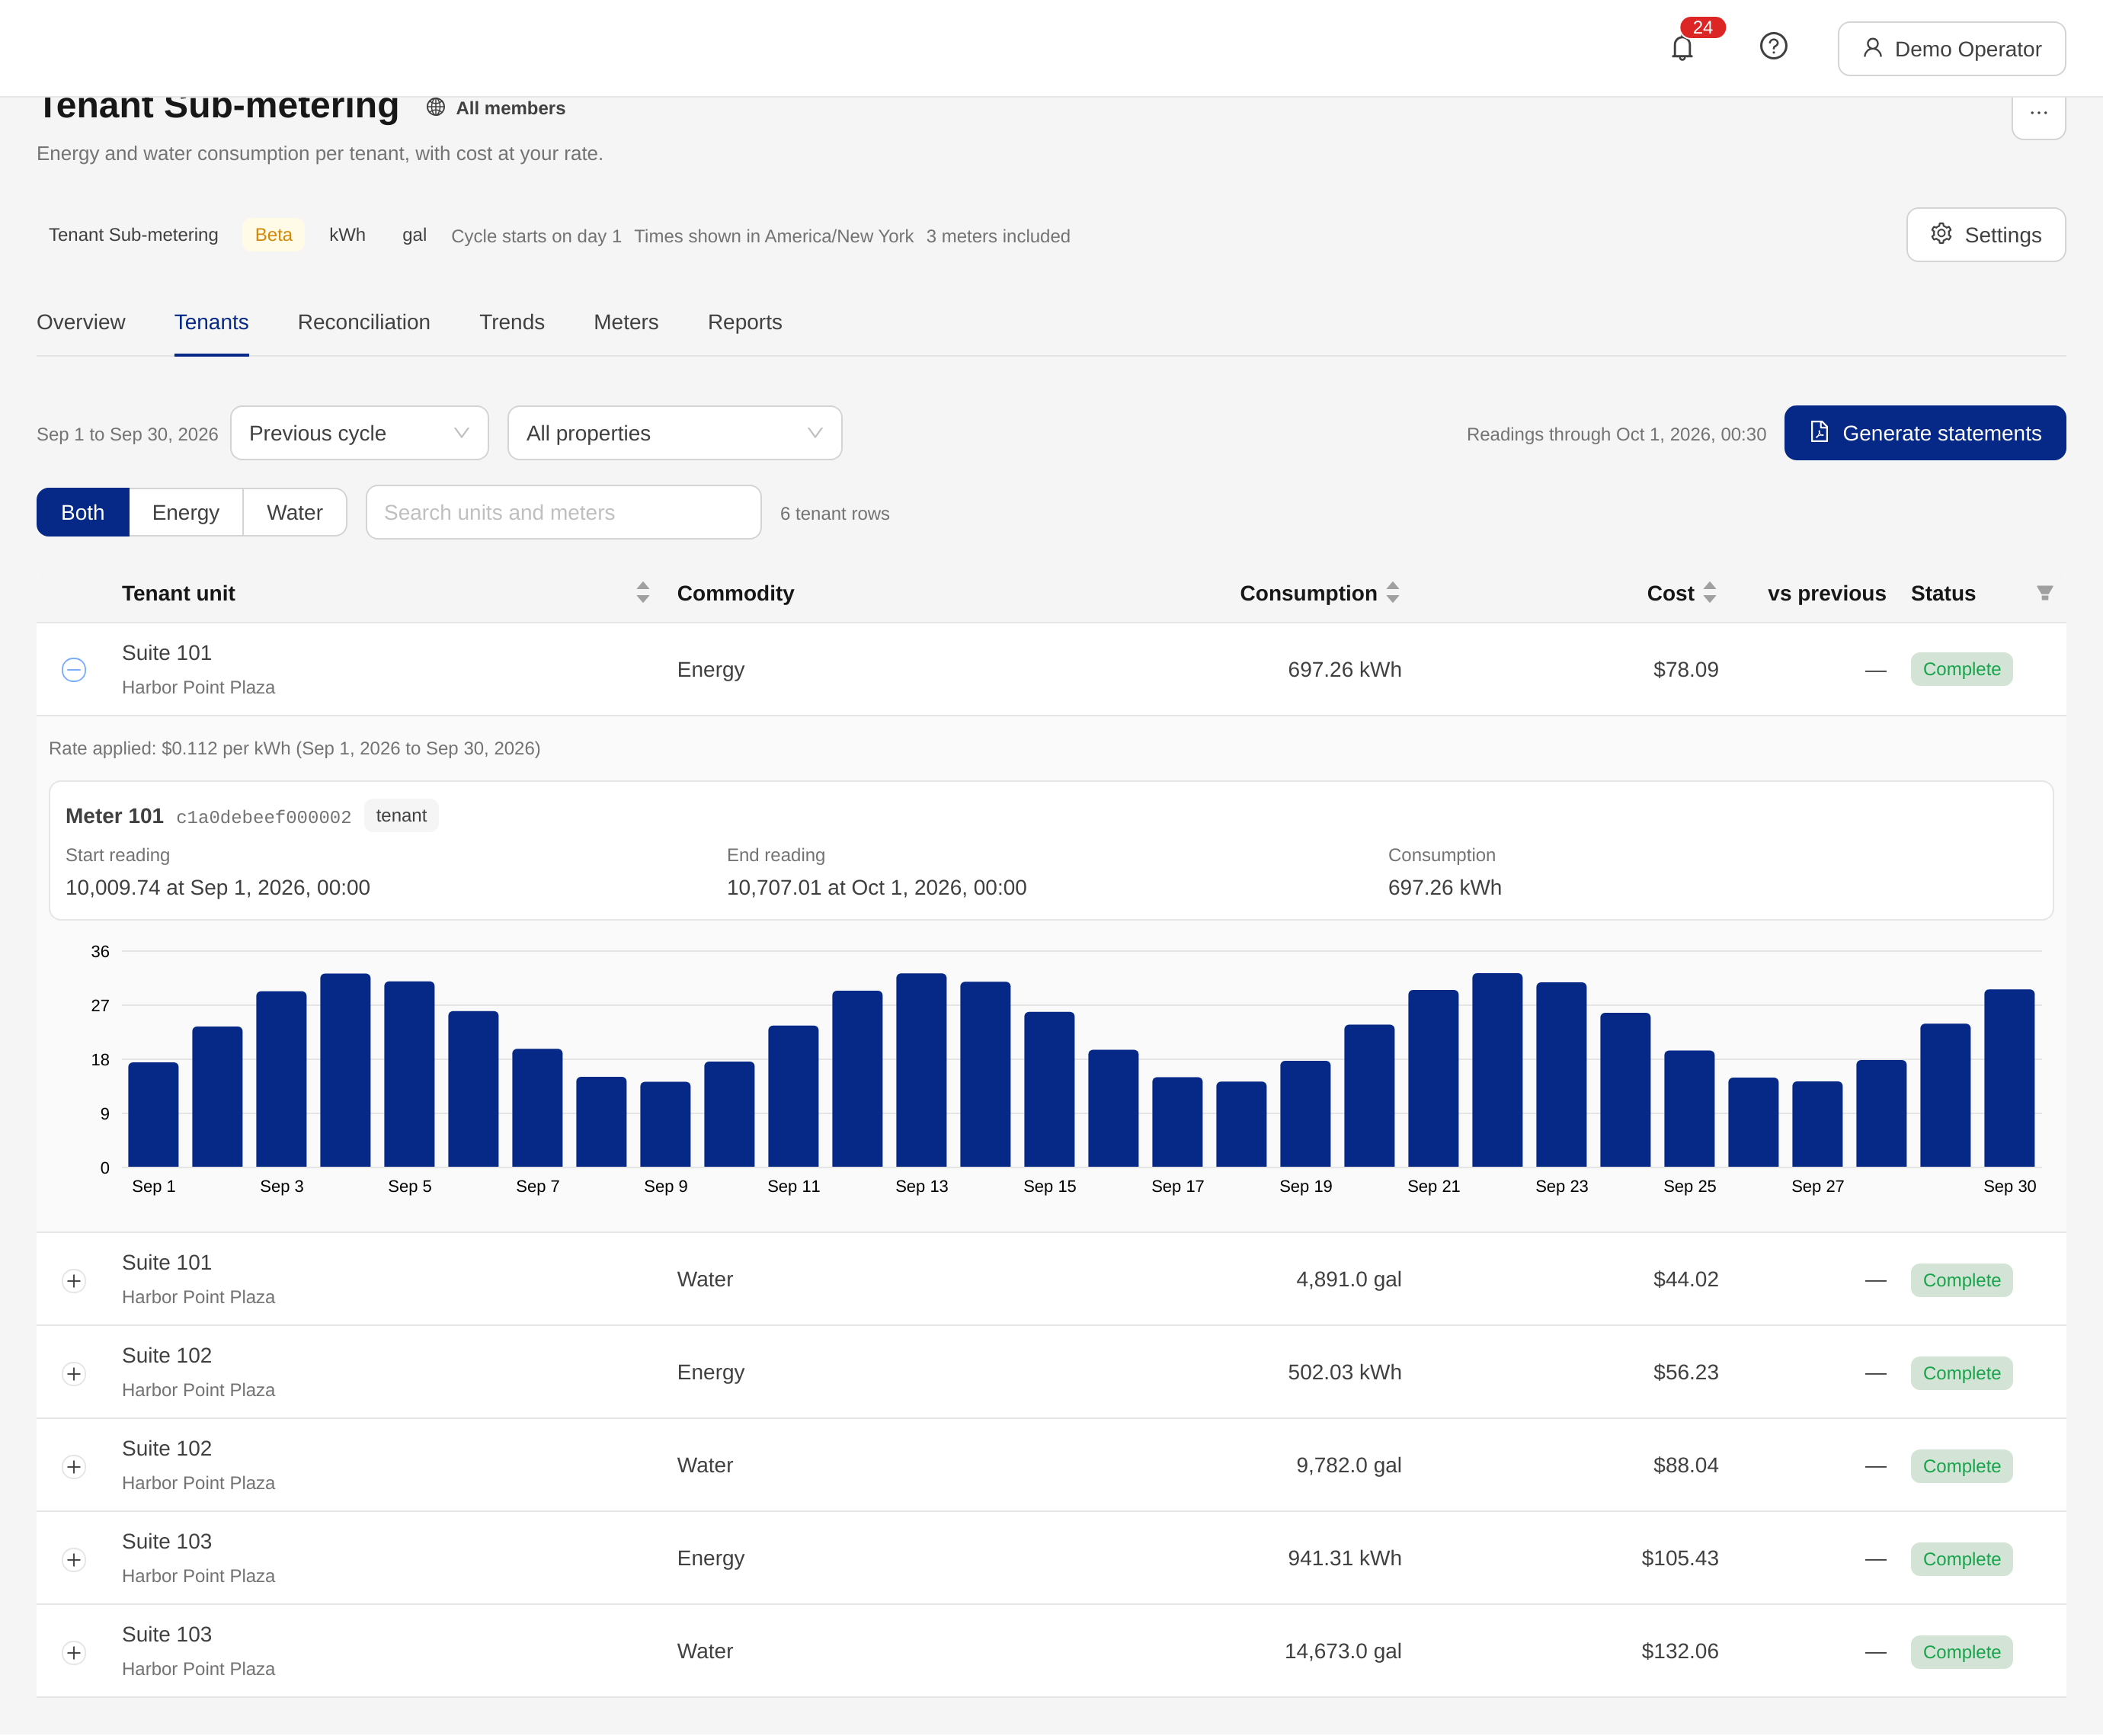
The vs previous column compares complete periods only: it stays blank when a meter did not cover the whole previous period or reset during it.
| Status | Meaning |
|---|---|
| Complete | Every meter in the unit has readings at both ends of the period and a rate applied. |
| Gap | A meter's last reading is older than the meter normally reports, so the end reading is stale. |
| No rate | Consumption is known, but no rate covers some days, so the cost is blank. |
| Reset | A meter reset in the period; see When a meter resets. |
| Owner | An owner meter; metered, no statement. |
Reconciliation
How much of what the property paid for is recovered from the tenants, in two ways:
- Main meters. When a property has a main meter, the tab compares its consumption with the sum of the tenant units for the period. The difference is unrecovered: common areas, losses, or a tenant meter that is missing or silent.
- Utility bills. Click Enter a bill and record the property, commodity, bill period, units billed and, if you like, the amount billed and a reference. The tab compares the bill with the metered total over the bill's own dates, shows what was recovered and what was not, and works out the bill's effective rate. Use rate copies that rate into the property's rates from the bill's start date, with a preview of what changes.
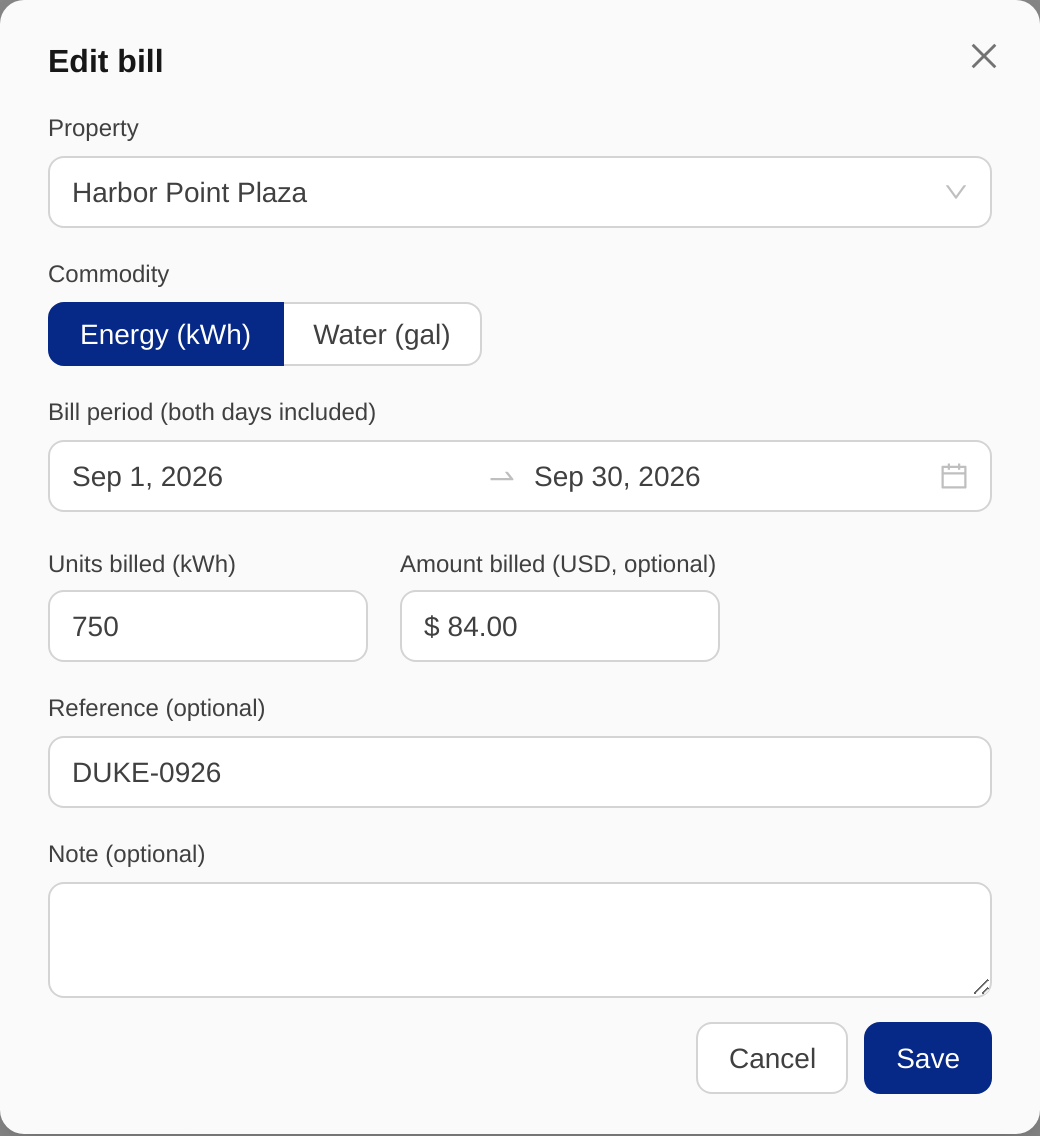
Two bills for the same property and commodity cannot overlap. A bill entered for a property that is no longer on the dashboard is kept but not reconciled.
Trends
Consumption or cost per billing cycle, as bars, for the last 6, 12 or 13 cycles, this year or last year. With All properties selected there is one series per property; with one property selected you can switch to one series per tenant unit. A dashed line shows the linear trend across the cycles that have data, and the tooltip gives the expected value on that line and the deviation from it.
A cycle in which a meter reset is left blank, a cycle before a meter's first reading shows no readings, and a cycle older than the hourly summaries your plan keeps shows no data.
Meters
Every included meter with its tenant unit, role, commodities, current reading, when it last reported and how often, and any resets or moves in the period. Devices inside a followed property that are not eligible are listed under Not included with the reason.
Reports
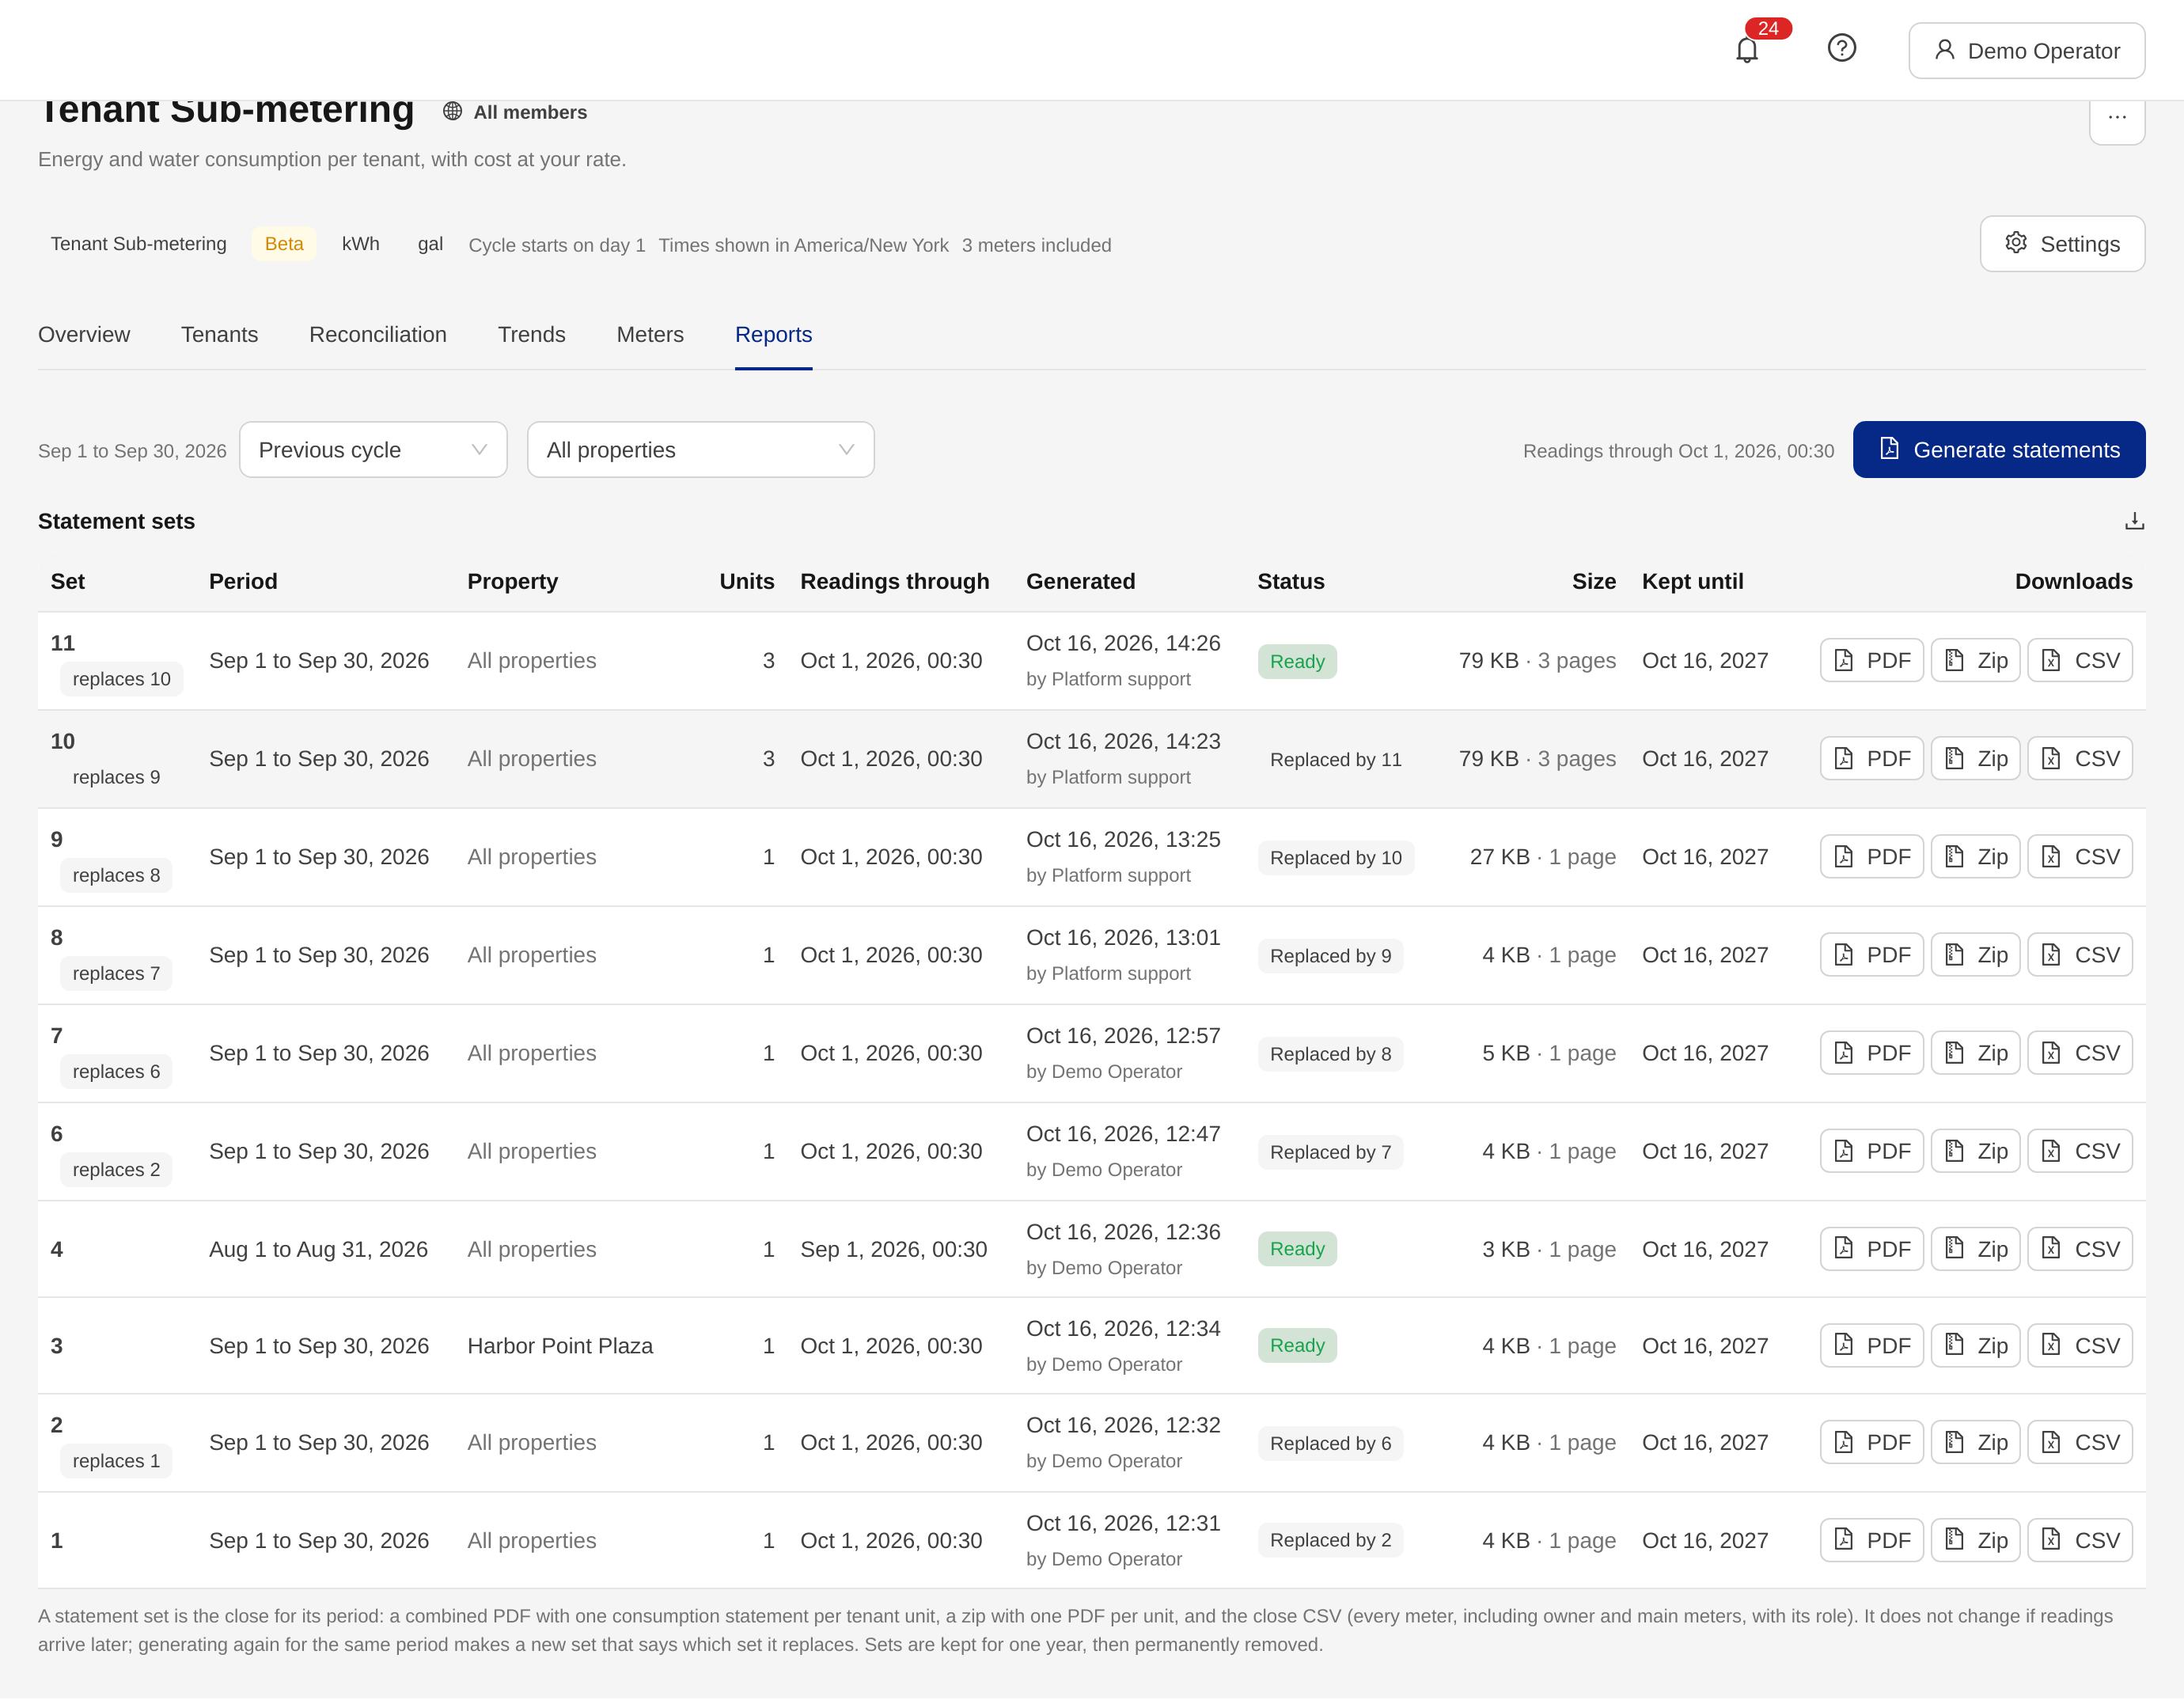
The statement sets generated for this dashboard; see Generating statements.
Generating statements
When a cycle has ended and the Tenants tab looks right, click Generate statements beside the period control. The dialog names the period and the property in view; confirm, and the set is prepared in the background, usually in under a minute. It then appears on the Reports tab with three downloads:
- PDF: one combined document with a consumption statement for every tenant unit, each starting on a new page.
- Zip: one PDF per tenant unit, named by set number and unit, so each tenant's statement can go with that tenant's invoice.
- CSV: the close for your billing system, one row per meter per commodity (one per segment after a reset, plus a unit total row for a unit with several meters), including owner and main meters with their role.
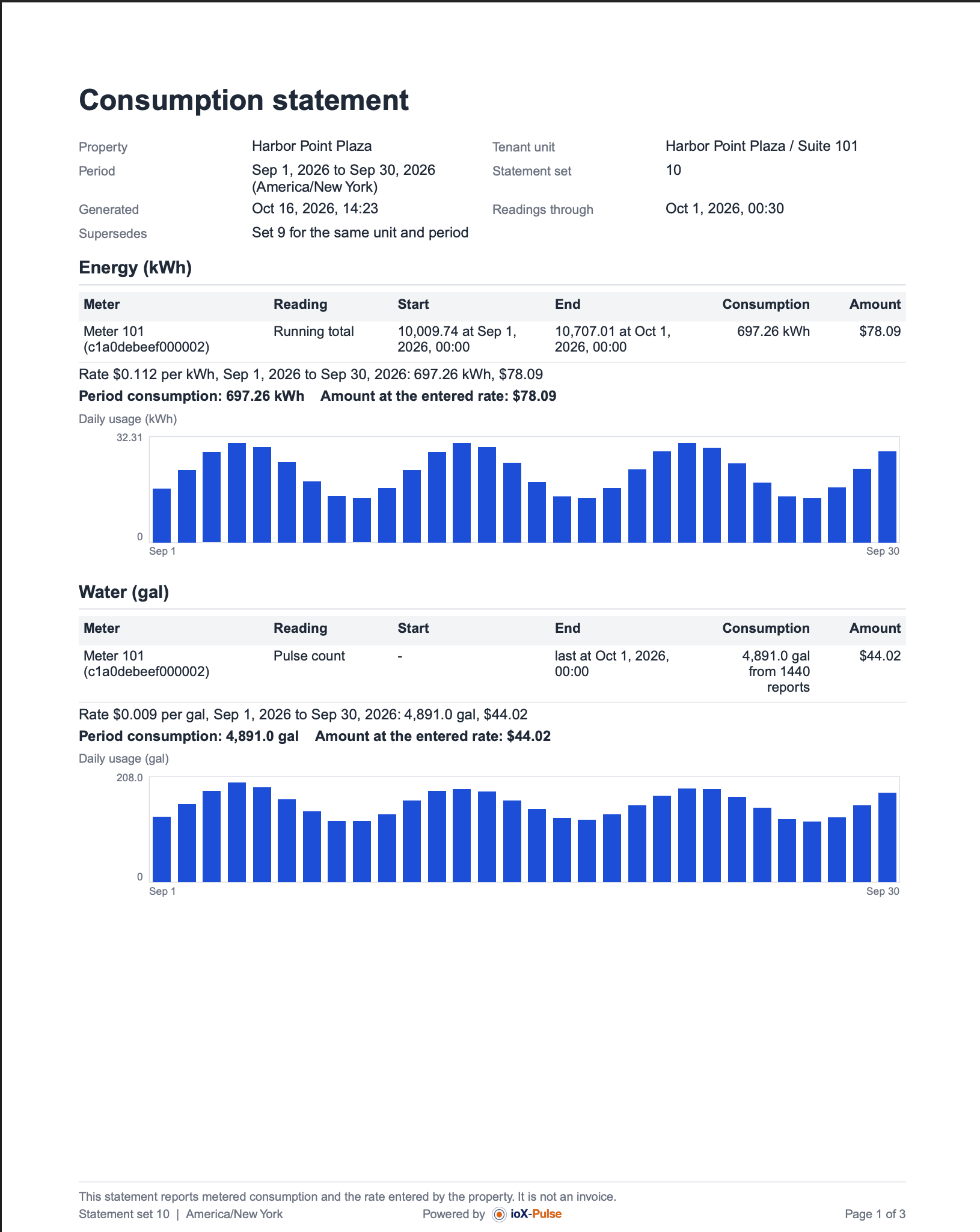
Each statement carries the property, the tenant unit, the period and time zone, the set number, when it was generated, readings through (the latest reading it includes), one block per commodity with the meter's start and end readings or pulse count, the rate ranges applied with the amount at each, the period consumption and amount, a daily usage chart, and any disclosures (a silent meter, a meter that moved, a site that was removed, days without a rate).
A statement set is the close for its period. It does not change if readings arrive later, and generating a set is what fixes the cycle day, water unit and time zone of the dashboard. Generating again for the same period and property makes a new set that says which set it replaces; the earlier set stays listed. Sets are kept for one year, then permanently removed.
If you generate a set for the current, unfinished cycle, the dialog warns you: the statements cover readings through today. Generate again after the cycle closes for the final set.
A set for a period in which no tenant unit had consumption is not created; the Reports tab says so.
When a meter resets
A meter register that goes back to a lower value, after a replacement or a counter rollover, has reset. The dashboard then reports the readings before and after the reset as separate segments and gives no single period total for that meter, because none would be true. The Tenants tab shows the segments and the reset time; the statement prints each segment with its amount and the line "A meter reset occurred in this period. The segments above are reported separately; no single period total is given." The close CSV has one row per segment.
Attention before you close
The Overview lists what to look at before you generate statements. Thresholds for the first three are set under Settings, then Attention.
| Item | Meaning |
|---|---|
| Usage change | A tenant unit's consumption is up or down against the previous period by more than the threshold (default 50 percent). Complete periods only. |
| Zero consumption | A meter reported through the period but the unit used nothing: a stuck meter or an empty suite. Complete periods only. |
| Continuous water flow | Water flowed in every hour of the day on at least the threshold number of days (default 3): a leak signal. |
| Rate drift | The effective rate of the latest utility bill differs from the rate you pass through by more than the threshold (default 5 percent). |
| Silent meter | The last reading is older than the meter normally reports, so the end reading is stale. |
| Meter reset | See When a meter resets. |
| No rate | A tenant unit has consumption on days without a rate; its cost is blank. |
| Not in a tenant site | A meter sits in the property itself, in a site with sites beneath it, or in no site, so it is not reported under a tenant. |
| Not included | A device inside a followed property is not eligible; the reason is given. |
Attention items are on screen only. To be notified, use Workflows on the meters themselves.
What the terms mean
| Term | Meaning |
|---|---|
| Close | The consumption and cost of every tenant unit for a period, as the Tenants tab shows it and as a statement set fixes it. |
| Tenant unit | The site a meter sits in; the thing a statement is for. |
| Main meter | A meter for the whole property, used for reconciliation only. |
| Running total | A meter register; consumption is end minus start. |
| Pulse count | A per-report count; consumption is the sum of the counts. |
| Readings through | The time of the latest reading included in a period or a statement. |
| Statement set | One generation: the combined PDF, the zip and the close CSV for one period and one property or all. |
Limits and things to know
- A period is whole days in the dashboard's time zone, up to 92 days.
- Consumption is computed from the hourly summaries your plan keeps, so a period or a trend cycle that reaches further back than that shows no data for the missing part.
- Energy and water only, in US dollars, with flat and seasonal rates. Tiered and time-of-use rates, gas, other currencies and allocation of shared meters are not part of this dashboard.
- Meters in the same site are the same tenant unit. A statement is for a site, never for part of one.
- The dashboard reports; it does not notify. Alerts stay with Workflows.