The Fleet overview
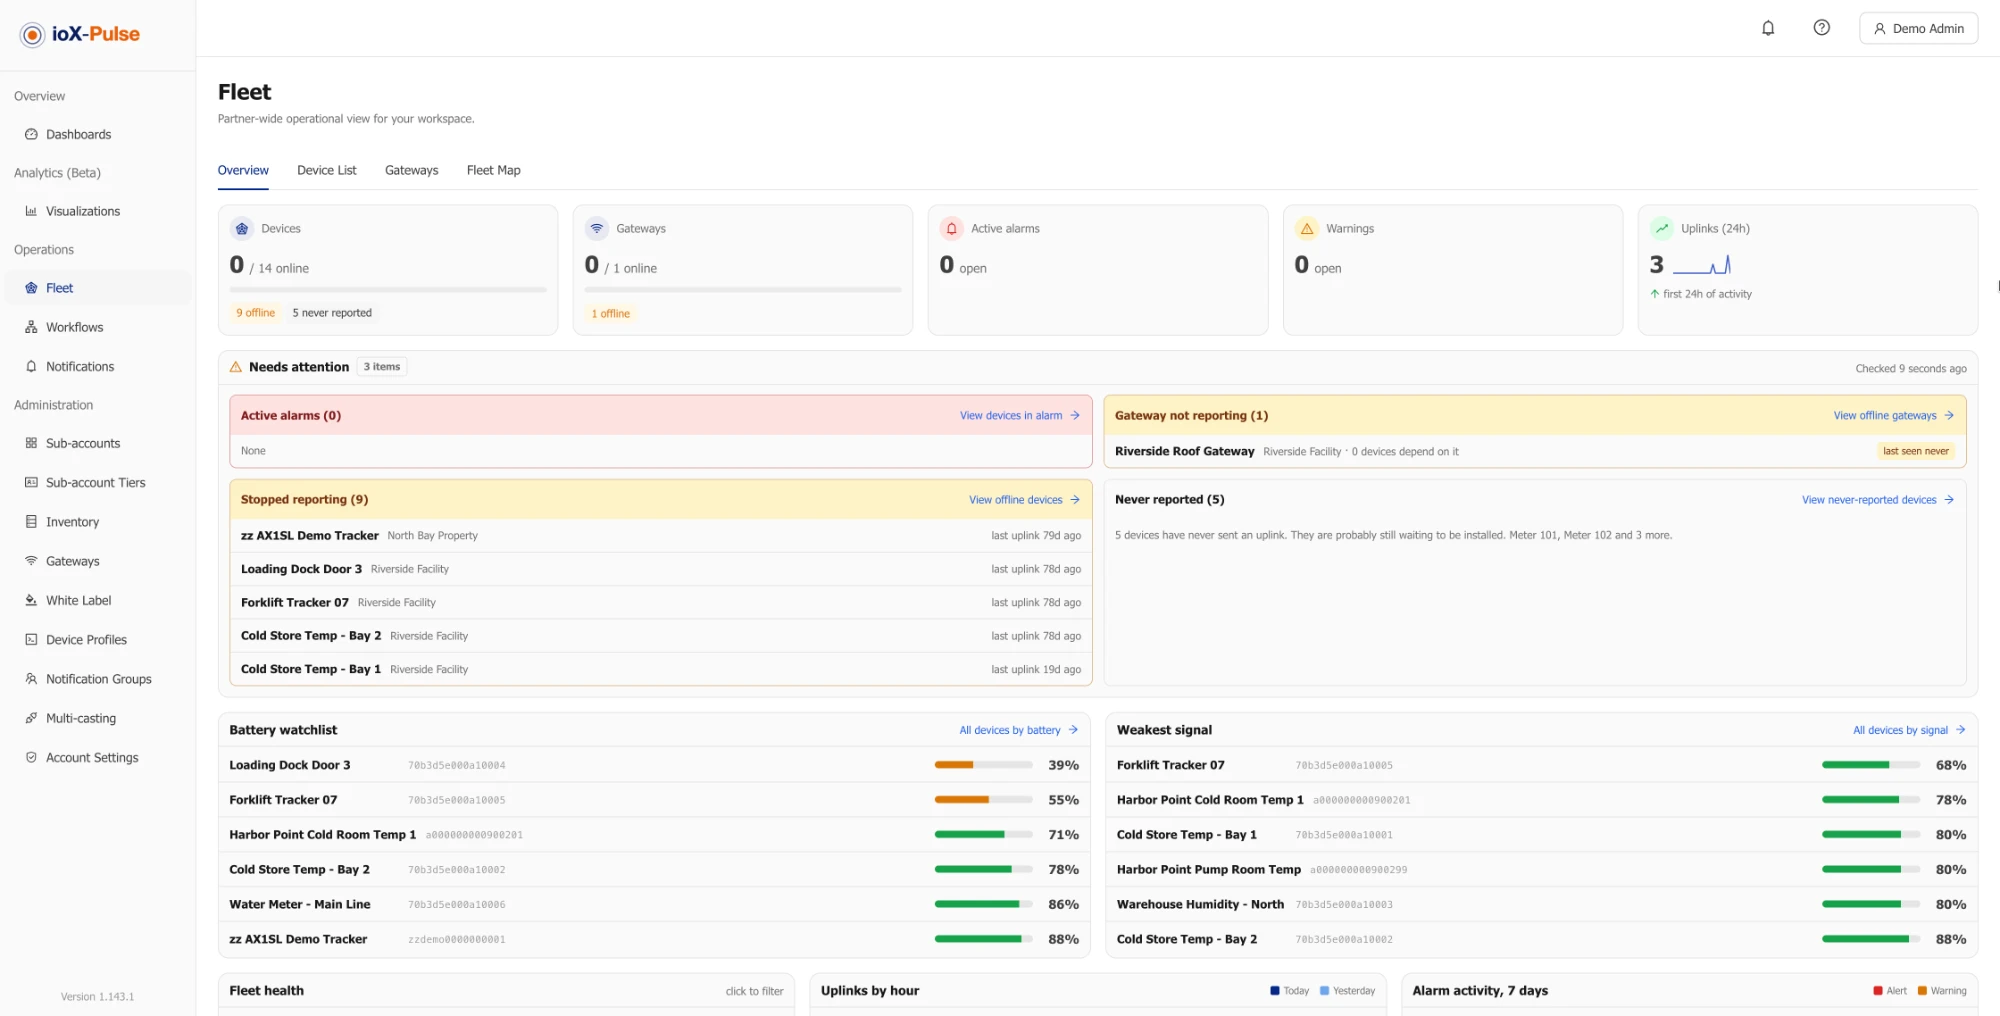
The Overview tab of the Fleet page is a one-screen health check of your devices and gateways: what needs attention right now, which batteries and connections are weakest, how the fleet is trending, and which gateways are carrying it. Every number and name on the tab is a link that opens the matching list, so you can go from "something is wrong" to the exact devices in one click.
Opening it
Click Fleet in the sidebar. The Overview is the first tab. It refreshes itself about once a minute while it is open, and the Needs attention card shows when it last checked. Switch to the Device List tab for the full, filterable table (see Finding your devices).
The tiles across the top
| Tile | What it shows | What it opens |
|---|---|---|
| Devices | Devices online out of all your devices, with chips for how many are offline (reported before, now silent) and how many have never reported. | The Device List; each chip opens it filtered to those devices. |
| Gateways | Gateways online out of all your gateways, with an offline chip. | The Gateways tab; the chip opens it filtered to offline gateways. |
| Active alarms | Devices whose highest open alarm is at the Alert level, plus an info chip for devices whose highest alarm is Info. | The Device List filtered to Alerting; the chip opens the Info devices. |
| Warnings | Devices whose highest open alarm is at the Warning level. | The Device List filtered to Warning. |
| Uplinks (24h) | Readings received in the last 24 hours, with a small trend line and the change against the 24 hours before. | Nothing; it is a figure. |
The tile counts and the lists they open use the same rule, so the number on the tile is always the number of rows you land on.
Needs attention
Four groups, always in the same place:
- Active alarms (top left): one row per device and rule, with the rule name, the device's site when you use more than one, the alarm level, how long it has been open, and an Acknowledge button.
- Gateways not reporting (top right): each gateway that has gone quiet, how many of your devices last reported through it, and how many of those have stopped reporting since.
- Stopped reporting (bottom left): devices that reported before and have now been silent for longer than their own offline threshold.
- Never reported (bottom right): devices that have never sent a reading. They are usually still waiting to be installed, so this group is a sentence rather than a list.
Each title carries the real count, and each View ... link opens the list filtered to exactly those devices or gateways. A group with nothing in it says None. Below the grid you will also see Certifications expiring and Devices over their daily uplink limit when either applies.
Acknowledging from the Overview
Click Acknowledge on an alarm row. The confirmation names the one alarm you are acknowledging, for example "Tank level low on Pump 2". Confirm, and that alarm is acknowledged for everyone, its notifications pause until it recovers, and the row disappears; other alarms on the same device are not affected. It is the same acknowledge as on a Status widget or the Device List, so your name is recorded in the same way. See Acknowledging an alert for what a pause means and how to resume notifications.
Permission required: Operator or Workspace Admin. Read-only users see the row without the button.
Battery watchlist and Weakest signal
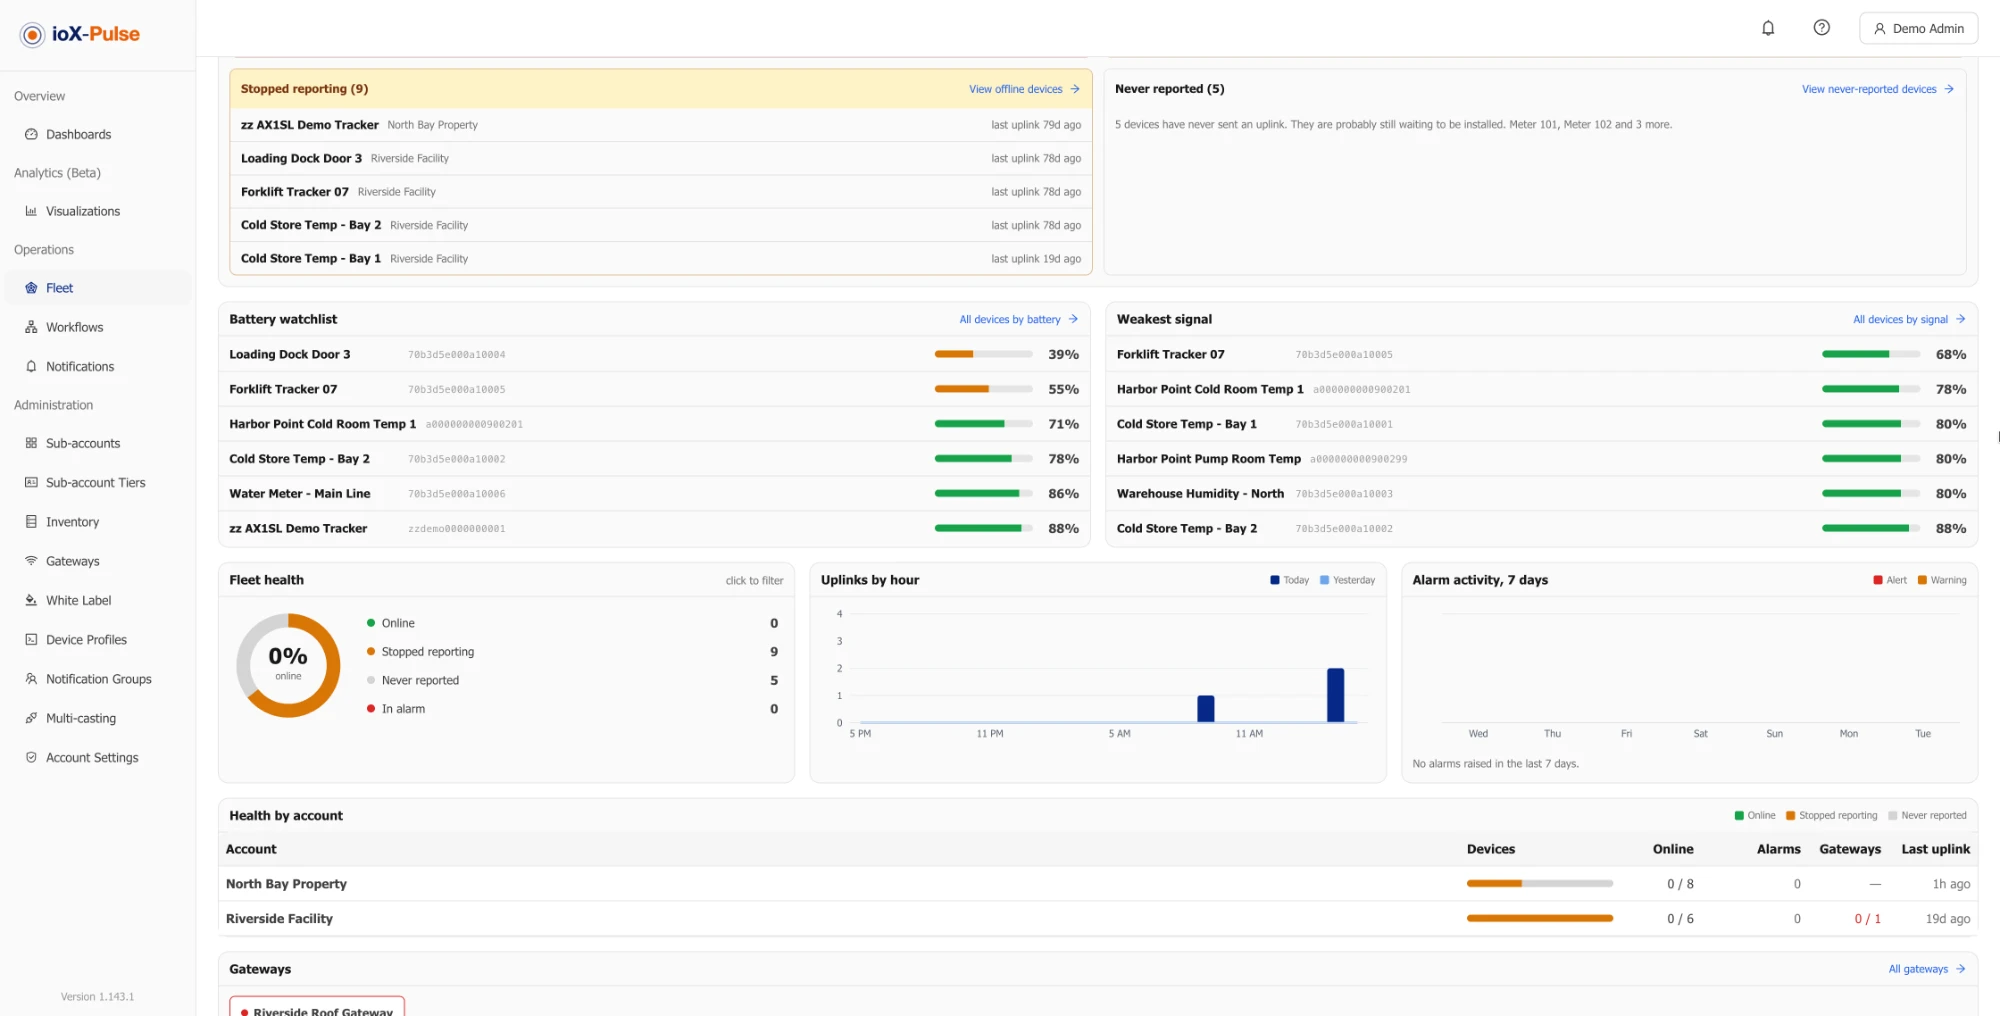
The six lowest battery readings and the six weakest signal readings across all your devices, each row showing the device name, its DevEUI, a meter, and the percentage. The meter colors follow the usual bands: battery Good, Low, and Critical (see Battery readings); signal Excellent, Good, Fair, and Poor. Devices that run on external power, and devices that have not reported a reading yet, are left out.
Click a row to open the device. All devices by battery and All devices by signal open the Device List sorted the same way, lowest first, so the watchlist continues down the page.
Fleet health, Uplinks by hour, Alarm activity
- Fleet health: a ring showing online, stopped reporting, and never reported devices, with the online percentage in the middle. Each legend line, including In alarm, opens the Device List filtered to those devices.
- Uplinks by hour: readings received per hour over the last 24 hours as bars, with the 24 hours before as a line, so a quiet gateway or a flat battery shows as a dip against yesterday. Hover a bar for both figures.
- Alarm activity, 7 days: alarms raised per day over the last week, Alert and Warning stacked, with a line underneath reading "N raised, M cleared. Noisiest rule: ..." so you can see which workflow is making the most noise. Info alarms are not counted here.
Health by site
When your workspace uses more than one site, a Health by site card lists each site with a bar of its devices (online, stopped reporting, never reported), the online count, alarm counts by level, gateways online, and the time of its last reading. Sites with the most trouble sort to the top. Click a row to open the Device List filtered to that site; a No site row collects devices that have not been placed at a site. The card is not shown when you have only one site.
Gateways
One chip per gateway with its online dot, how many devices last reported through it, and when it was last seen. Offline gateways come first with a red border. Click a chip to open the gateway; All gateways opens the Gateways tab.
Frequently asked
The Active alarms tile says 2 but the notification bell shows nothing. Why? The tile counts devices with an open alarm right now; the bell shows notifications raised for you, which depends on the rule's recipients. See Responding to alerts.
A device is in "Never reported" but I installed it yesterday. It has not sent a reading yet. Check that it is powered on and within range of a gateway; its first reading moves it out of the group on its own.
Why is there no Health by site card? It appears only when your workspace has two or more sites. See Sites.