Facility Monitoring dashboard
The Facility Monitoring dashboard answers three questions about a property, in this order: what needs attention now, who is driving consumption, and are we improving. It reads every energy and water meter in a property, reports consumption per tenant with its carbon, flags a tenant whose usage is above what its own history says to expect, splits the main meter into tenants, common area and unmetered, counts vehicles or people when you have counters, tracks a yearly reduction target, and produces a monthly sustainability report and a scorecard for each tenant. There are no widgets to place.
This dashboard is in beta. It is being tested with early users and may change. Please tell your provider what you find.
Do you have this? Dashboard templates are a plan feature, and this one also needs Multi-site, because a tenant on this dashboard is a site. If the New dashboard dialog does not offer a Facility Monitoring type, your provider has not enabled it for your workspace. Creating the dashboard, choosing devices, setting roles, factors, rates and targets, and changing settings needs Workspace Admin access (or an Operator who has been allowed to manage dashboards). Everyone who can open the dashboard can read it, export the tenants and generate reports.
This is not billing. Nothing on this dashboard, in its reports or on a scorecard is a bill. It reports metered consumption, carbon at the factors you enter, and an estimated cost at a blended rate for orientation only. Tenant invoices, statements and the close belong to the Tenant Sub-metering dashboard.
How a property is modeled
The dashboard uses your sites:
- A property is a site you tick when choosing devices. A dashboard can cover one property or several.
- A tenant unit is the site a meter sits in. Create a site for each suite, unit or shop under the property and attach the tenant's meters to it. "Harbor Point Plaza / Suite 101" is a tenant unit. See Sites for how to arrange them.
- Every meter is a tenant meter until you say otherwise. A meter that measures the whole property is a main meter; a meter the landlord holds for lighting, pumps, lobbies or parking is a common area meter. You set these roles on the Devices tab; nothing is inferred from names or positions.
- A counter has no role. A vehicle counter or a people counter counts with the property it is in. A counter in a tenant's site still counts with the property, and the Overview says so under Setup.
- A network is only a label. A reading is reported under the site its meter was in when it was taken.
A tenant meter attached to the property itself, or to a site that has sites beneath it, is listed under Setup on the Overview. A meter in no site at all is reported as Unsited.
Floor area
Intensity per square foot is the only fair way to compare tenants of different sizes, so each site can carry a floor area in square feet: open the site, edit it, and enter the area under Facility. Enter it on each tenant's site and on the property's own site; a property's intensity uses the property's own area, never the sum of its suites. A unit without an area is still reported, but it is left out of the intensity ranking, and the Overview lists it under Setup. See Create a site.
What a device needs on its profile
The dashboard reads tagged fields and nothing else. On the device profile, tag:
- an energy field as Energy (kWh);
- a water field as Water (gal) or Water (L), matching the unit you choose for the dashboard; a meter tagged in the other unit is listed as not eligible with the reason;
- a vehicle count field as Vehicle count, or a people count field as People count.
Each tagged field also needs its aggregation kind: Absolute for a running total that only goes up (a register), or Counter for a count since the last report (a pulse count). A tagged field without a kind is not read; the device list says so. A pulse meter whose pulses are not units is converted on the profile with a formula field; the dashboard never multiplies. See Customizing profiles.
Creating the dashboard
- Go to Dashboards in the sidebar and click + New Dashboard.
- Choose the Facility Monitoring type and give the dashboard a name.
- Choose the water unit (gallons or liters), the grid region for the energy carbon factor, the reporting time zone and the clock format.
- Click Create, then Select devices.
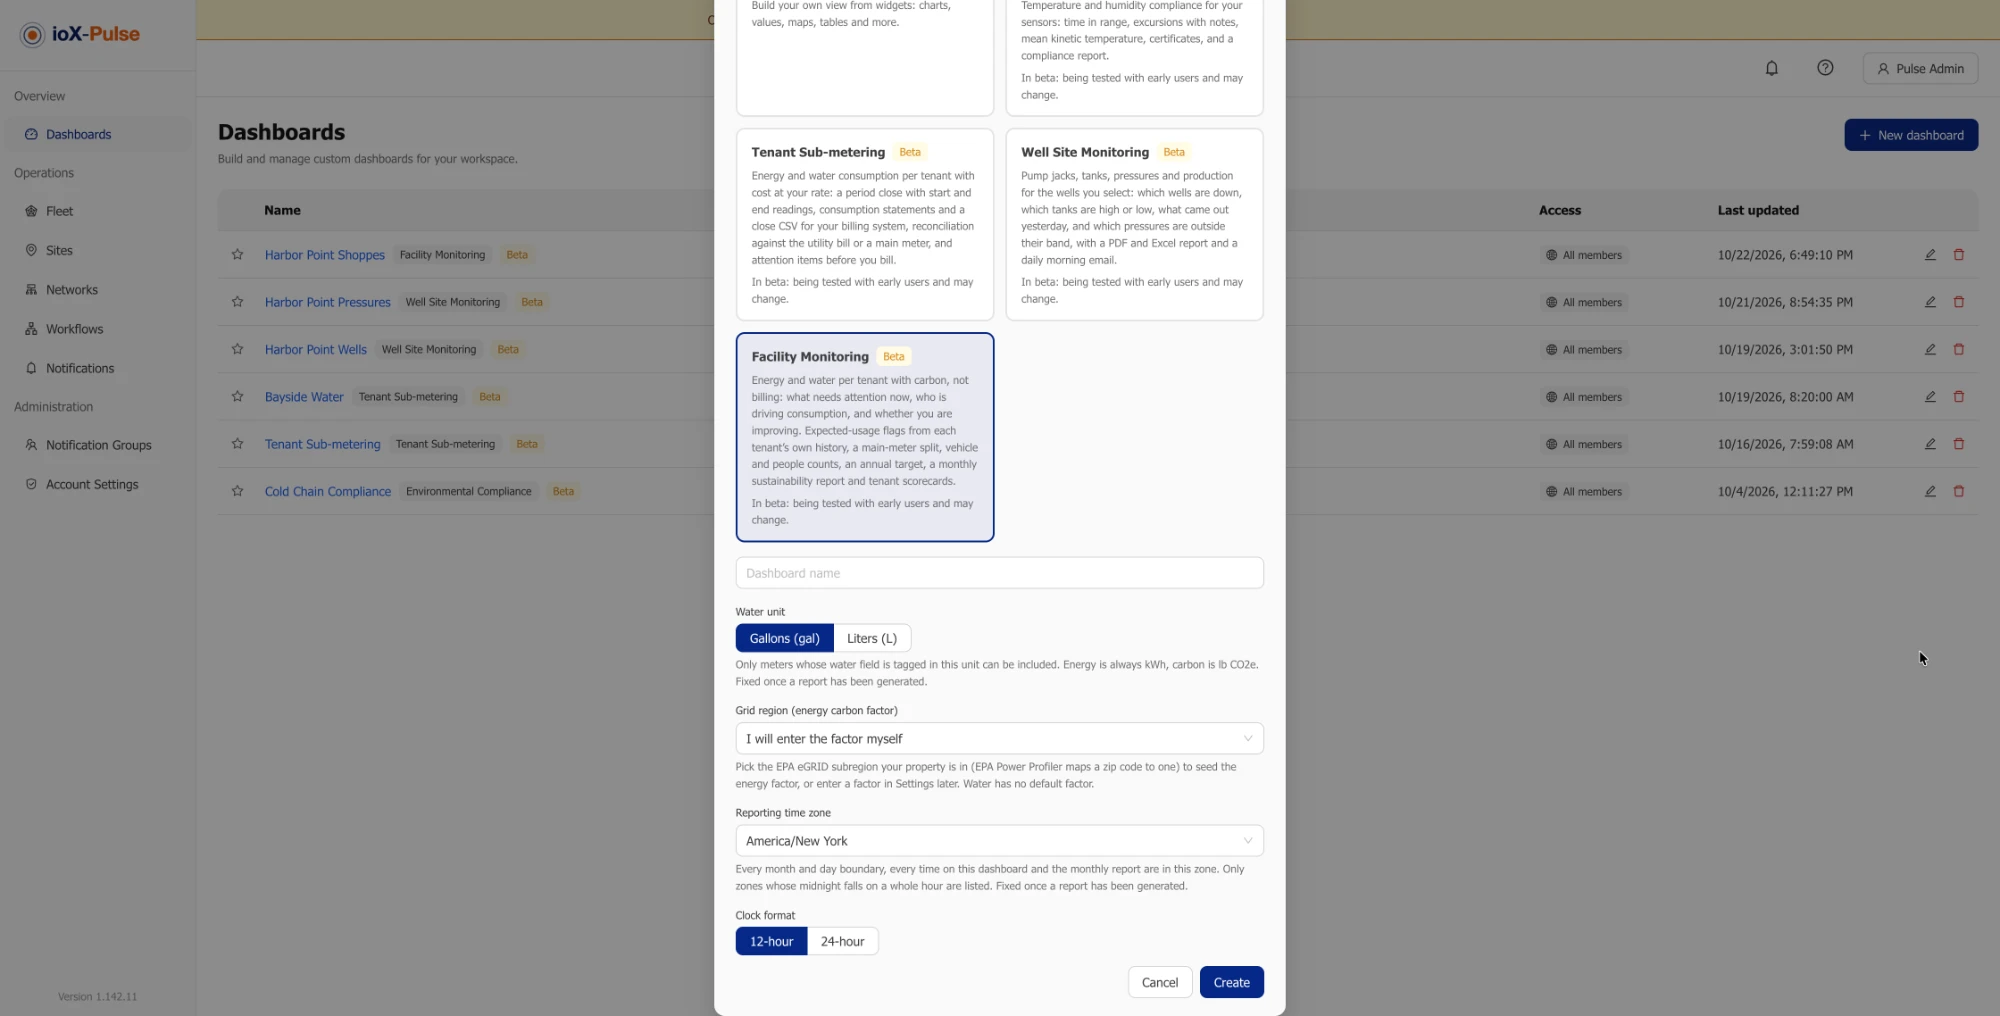
The grid region is the EPA eGRID subregion your property's electricity comes from, such as "SRMW, SERC Midwest". The dashboard stores that region's emission rate as the dashboard's energy carbon factor, in pounds of CO2e per kWh, with the source and the date it applies from, and you can change it later under Settings. To find your subregion, enter your zip code in the EPA's Power Profiler. Choose I will enter the factor if you have a factor from your own utility or a green tariff. Water has no default factor; see Carbon factors.
The time zone belongs to the dashboard, not to the person reading it. Every month and every day starts and ends at midnight in that zone, and the monthly report is sent on that clock. Only zones whose midnight falls on a whole hour can be chosen.
Under Settings, then General, you can also upload a PDF report logo: a PNG or JPEG (up to 500 KB and 2000 px; about 600 x 200 px works best) that prints top left on the first page of every PDF this dashboard generates, on demand and scheduled. Excel and CSV exports never carry it; without a logo the reports show only the "Powered by" mark in the footer.
Who can do what
| Action | Who |
|---|---|
| Open the dashboard and read every tab | Everyone the dashboard is shared with: Viewers, Operators and Workspace Admins |
| Export the Tenants tab, generate reports and scorecards, download them | Everyone who can open the dashboard |
| Create the dashboard, choose devices, set roles, factors, rates, targets and thresholds, change settings, delete it | Workspace Admins, and Operators who have been allowed to manage dashboards |
A teammate who is limited to a site sees this dashboard only when everything it includes is inside their site, and can download a report only when every site in it is one of theirs. The monthly email covers a whole property, so members of the notification group who are limited to a site are skipped, and the Reports tab says how many.
Who the dashboard is shared with is set from its ⋯ menu, the same as any other dashboard. A template dashboard cannot be shared by public link.
Choosing devices
Open the dashboard and select Select devices, or Settings then Devices. Tick a property to include every eligible meter and counter in it and in the sites beneath it, now and in future, or tick devices one by one. The picker shows what each device measures (energy, water, vehicles, people) and why a device is not eligible. Up to 500 meters and counters can be on one dashboard.
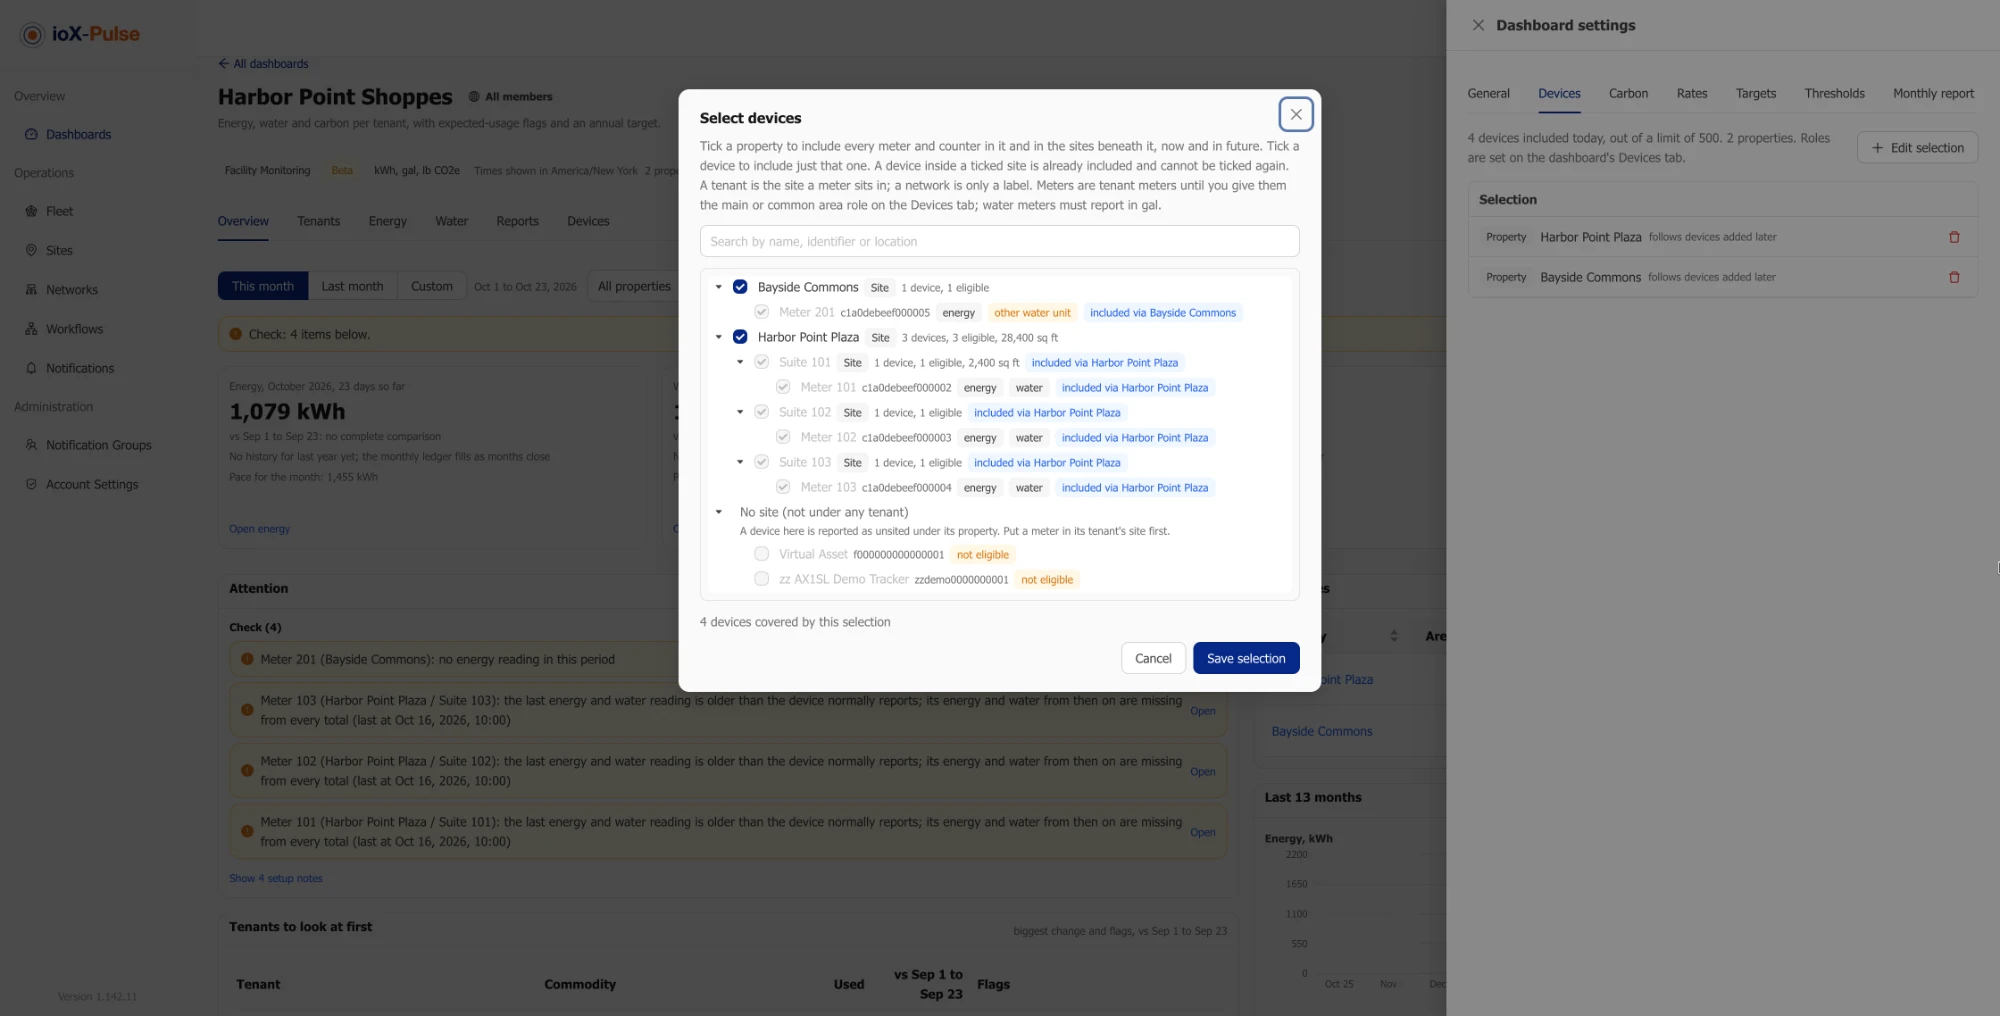
Each included device is listed on the Devices tab with its site, what it measures, its last reading and, for a meter, its role: Tenant, Main meter or Common area. Choose the role on the row, or use Apply to give one role to every meter in a site, then Save roles. Counters are listed with no role.
Choosing the period
Above the tabs, This month (the first of the month through today), Last month, or Custom (whole days, up to 92). Beside it, All properties or one property; every tab, the export and the next report follow it. Both are in the page address, so a link reproduces the view. The line beside them reads Readings through followed by the time of the latest reading.
Every figure for a month compares against two things:
- vs the previous period. On an open month, the first days of last month up to the same day, printed as "vs Sep 1 to Sep 23". On a closed month, the whole previous month. On a custom range, the same number of days immediately before it.
- vs last year. On an open month the comparison is pace: this month's daily average against the same month last year's daily average, printed as "pace vs Oct 2025", because a partial month is never set against a full one. On a closed month, the whole month a year earlier. Last year comes from the stored month totals, so it appears once the dashboard has been running for a year; before that the tile says so.
An open month also shows its pace for the month: the total so far scaled to the whole month.
Reading the tabs
Overview
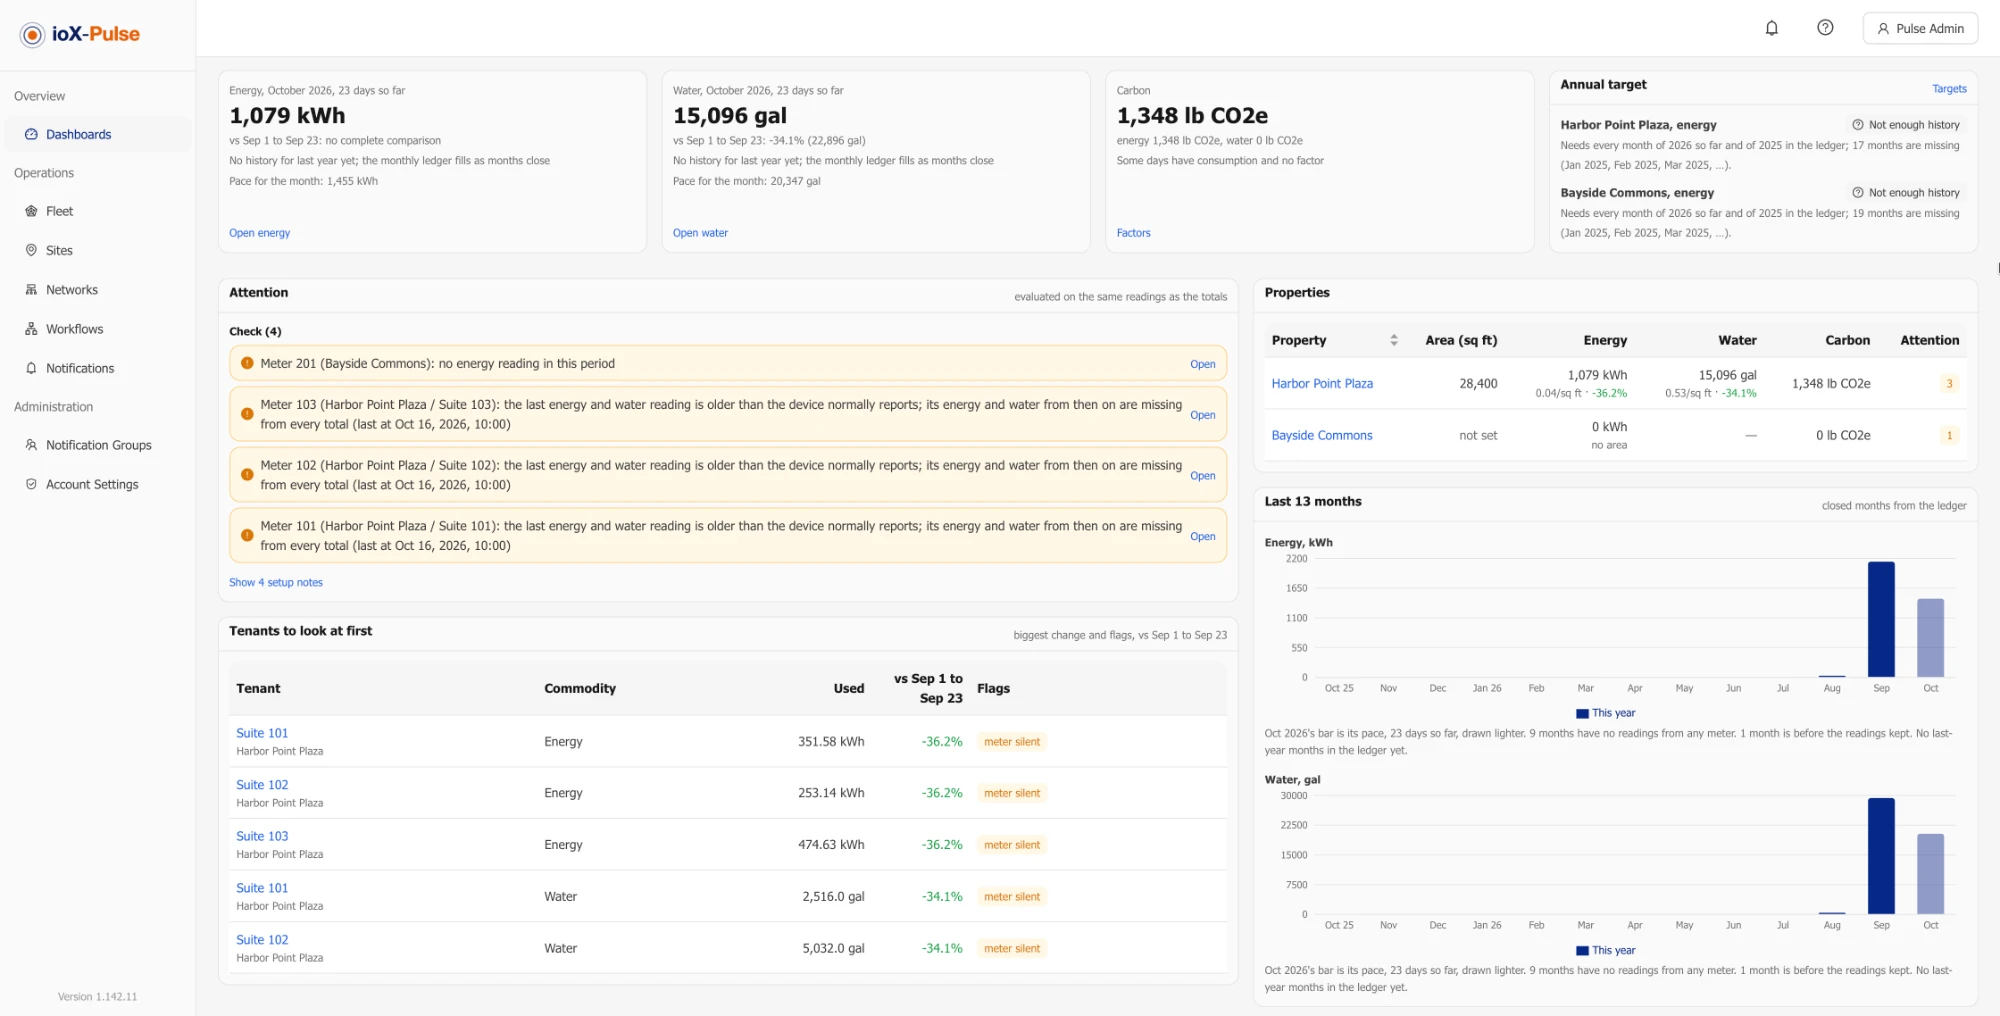
The Overview answers the first question: what needs attention?
- Four tiles: Energy and Water for the period with both comparisons and the pace, Carbon for both with the factors in force, and Annual target with a progress bar and a status in words.
- Attention, in three groups: Act now, Check and Setup. Each row says where, what and how much, and opens the tenant, the commodity tab or the devices. Setup is folded behind show the notes while the other groups have rows.
- Tenants to look at first: the five units with the biggest change or a flag.
- Where it goes, for one property with a main meter: tenants, common area and unmetered as shares of the main; with several properties, a table with one row per property.
- Last 13 months: energy and water per month from the stored totals, the same month last year beside each bar, and the current month drawn lighter as its pace.
Tenants
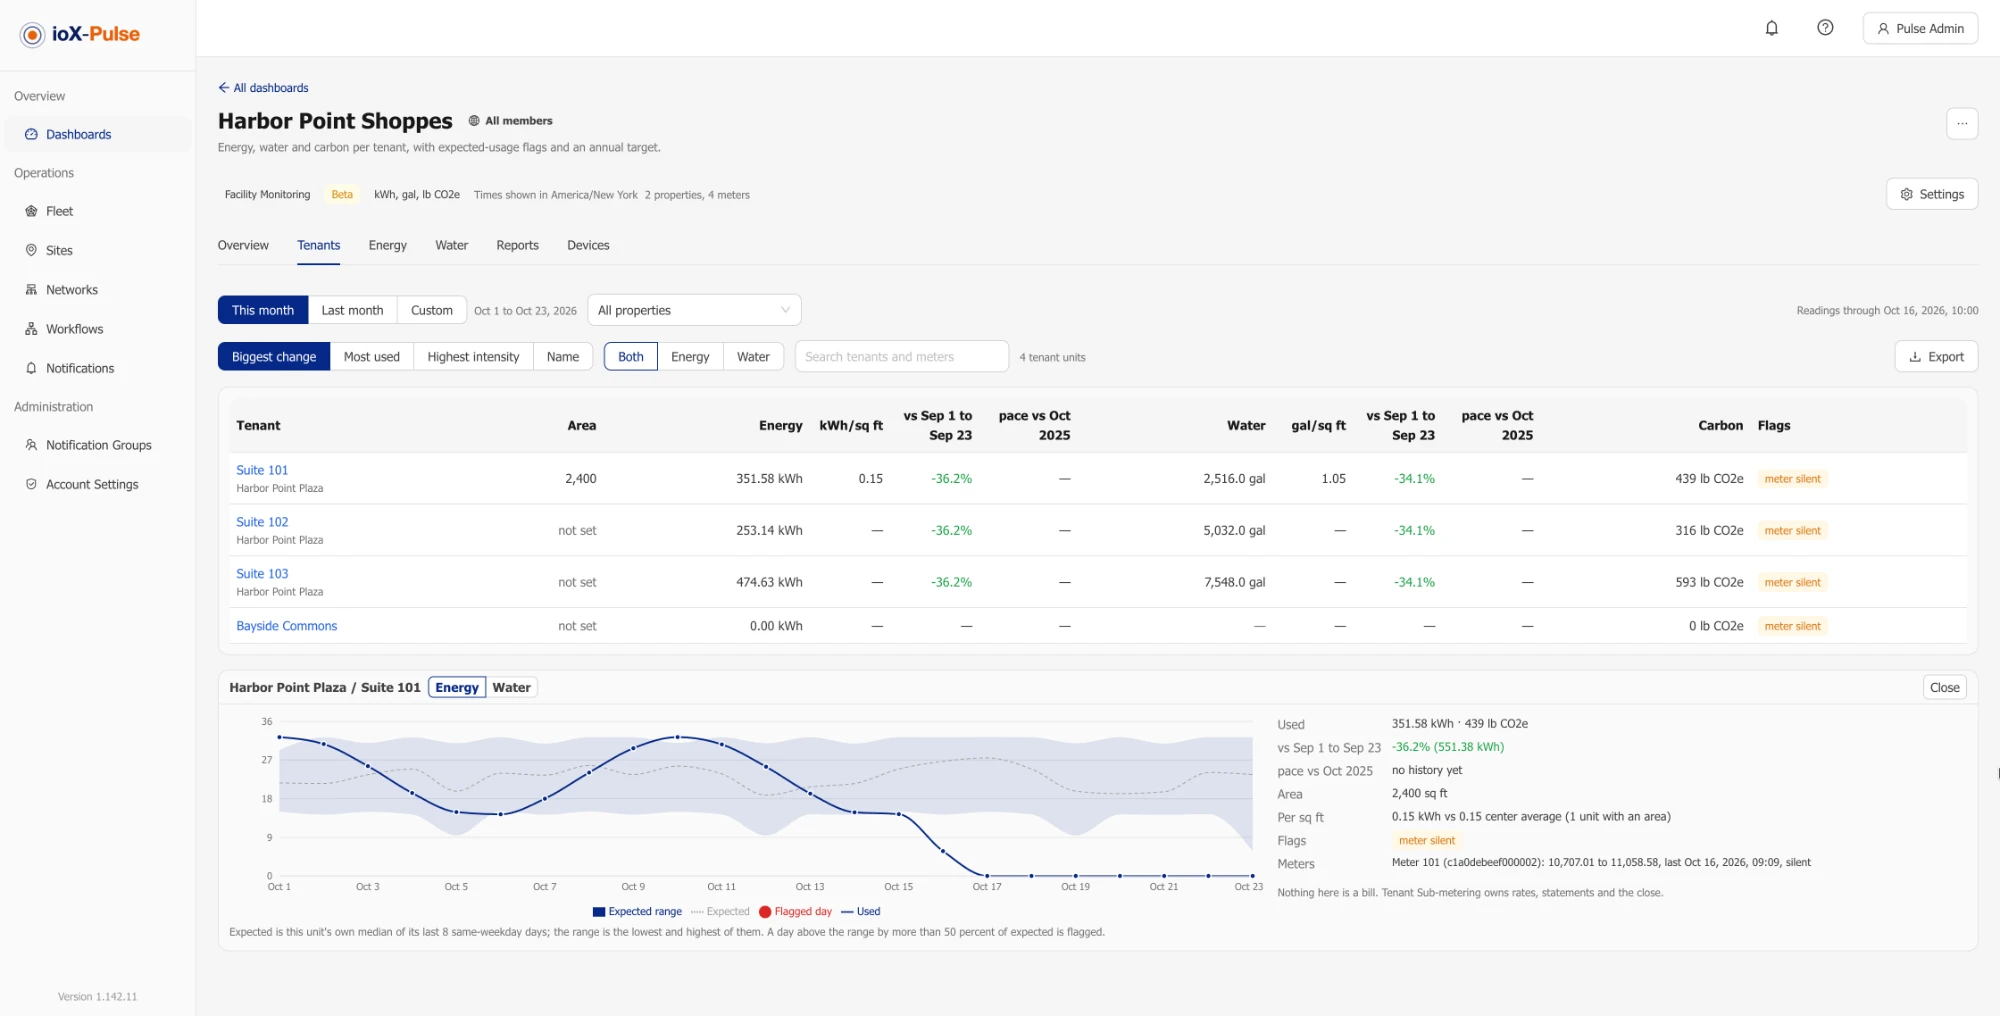
One row per tenant unit with both commodities side by side: floor area, energy, kWh per square foot, both comparisons, water, gallons (or liters) per square foot, both comparisons, carbon and flags. Sort by Biggest change, Most used, Highest intensity or Name; show Both, Energy or Water; search by name. The common area rows sit in a second group under the tenants. Export downloads the table as CSV or Excel.
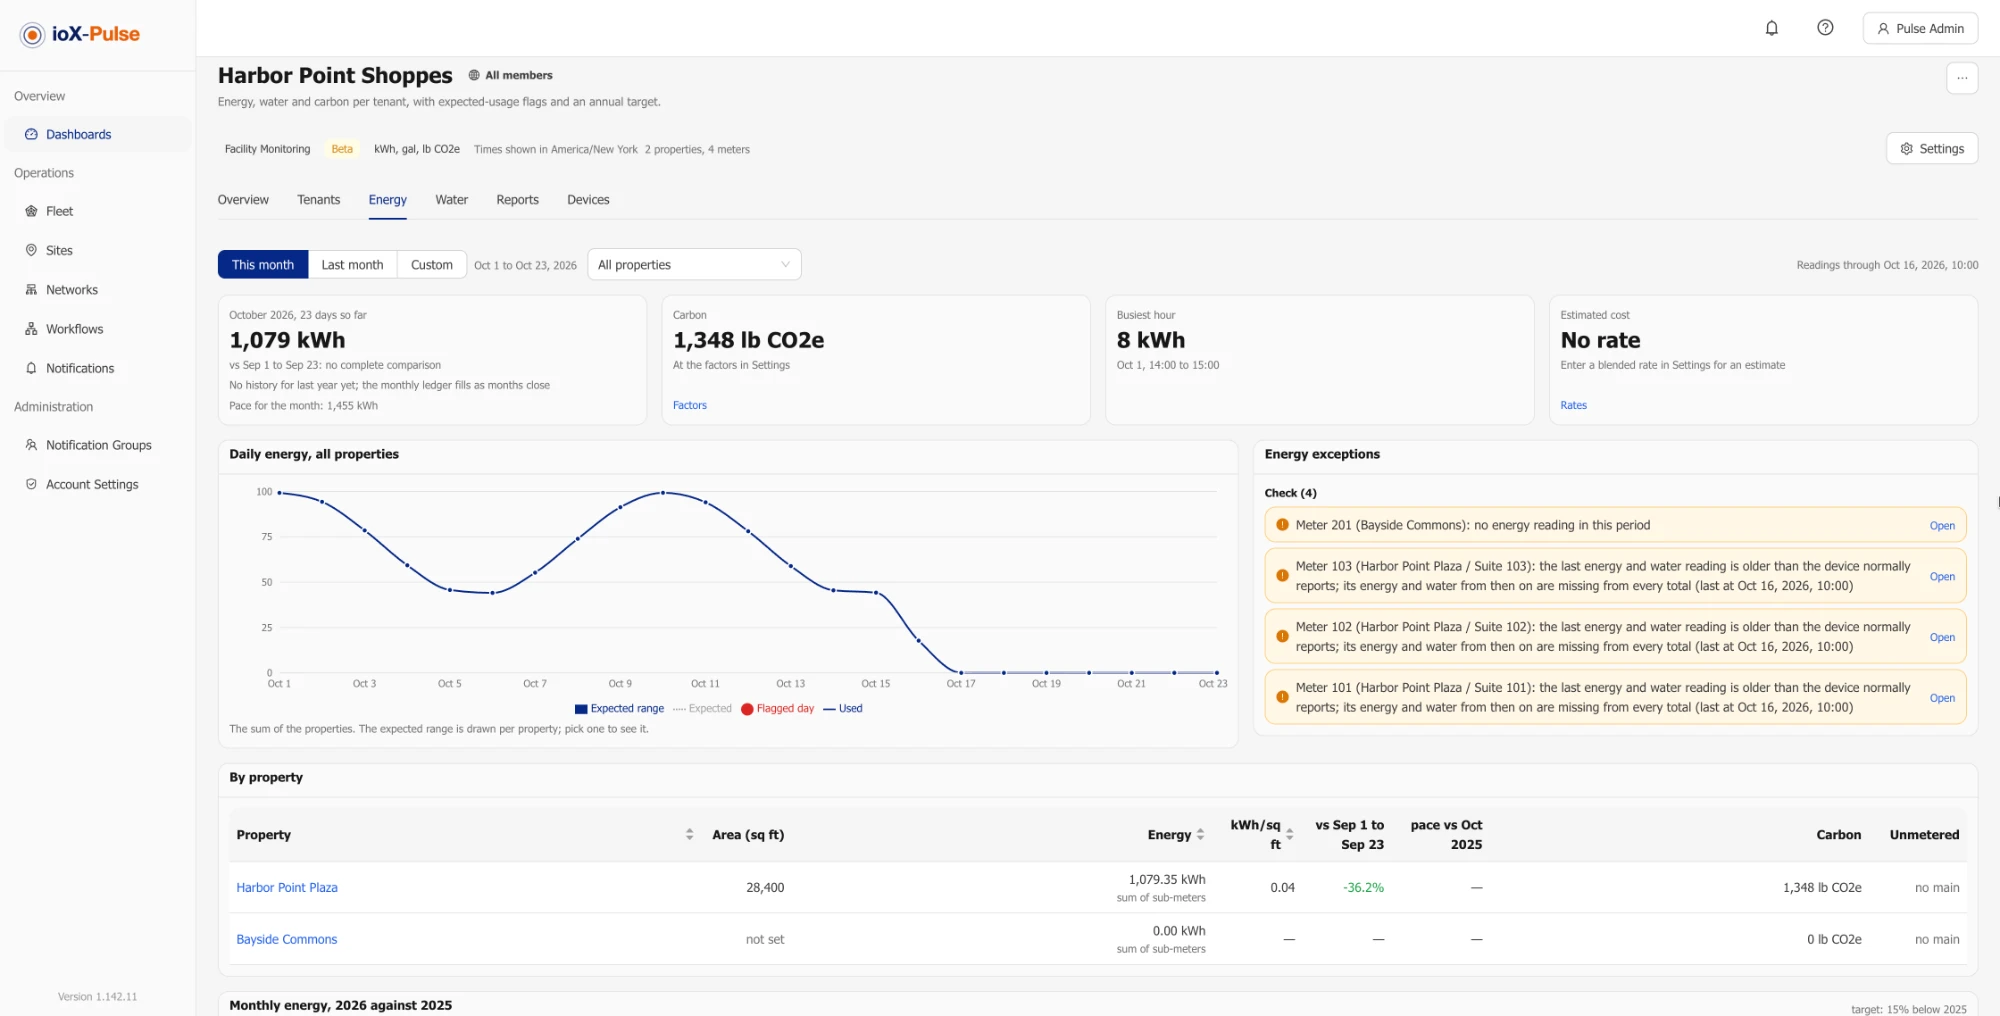
Click a unit to open it: the daily chart with the expected range shaded, the expected value dashed, the days used as a line and the flagged days as red dots; then the facts, used with carbon and cost, both comparisons, the area and the intensity against the center average, the flags with the excess, and each meter with its readings.
Energy and Water
Four tiles: the period's total with both comparisons and the pace; carbon; busiest hour on Energy (the hour with the largest increment in the period) or of which likely waste on Water with the night minimum (the smallest hourly flow between 1 and 5 AM over the last seven nights, a figure and not a rule); and estimated cost when a rate is entered. Then the daily series with the expected range, the exceptions for that commodity, one row per property with its split and unmetered share, and the monthly bars of the year against last year with the target line when every property in view shares one target.
Vehicles, Visitors or Counts
Present when a counter is on the dashboard, named for what you count. One block per kind, never added together: the count with both comparisons, energy per vehicle or per person, water per vehicle or per person, carbon per vehicle or per person, weekly bars with the energy per visit printed under each week, and the counters behind them.
Reports
The monthly sustainability report and the tenant scorecards; see Reports and scorecards.
Devices
Every included device with its site, what it measures, its role and its last reading; the place to set roles.
Expected consumption and flags
The dashboard never asks you for a limit. A unit's expected consumption for a day is the median of its own last six same-weekday days with data (at least three; the counts are in Settings, then Thresholds), and its range is the lowest and highest of them. A day is flagged when it is above the range by more than 50 percent of expected. The excess is used minus expected on the flagged days, and when a rate is entered it is also shown in dollars. A flagged day stays in later samples, so a tenant that uses more every week stops being flagged once that is its normal. Until a unit has enough history the chart says expected is still forming and nothing is flagged.
| Flag | Meaning |
|---|---|
| Continuous flow | Water flowed in every hour of the day on at least the configured number of days: a leak signal. Act now. |
| Above expected, running | Above the expected range on each of the last three days. Act now. |
| Above expected | Above the expected range on at least one day in the period. |
| Usage change | Up more than the monthly change threshold against the previous period. |
| Zero use | No consumption in the period although the meter reported: a stuck meter or an empty suite. |
| Meter silent | The last reading is older than the meter normally reports; its figures stop there and no change flag is drawn from it. |
| Reset | A meter reset in the period; the unit has no single total. |
| Improving | Down by more than the monthly change threshold against the previous period. |
Two more items concern a property rather than a tenant: unmetered rising, when the share of the main meter that no sub-meter accounts for rose by more than the configured points against the previous period, and sub-meters exceed the main, which usually means a tenant meter is really the main or the other way round.
Carbon factors
Carbon is reported in pounds of CO2e: each day's consumption times the factor in force that day. Under Settings, then Carbon, the dashboard keeps a list of factors per commodity with the date each applies from and its source; the energy list starts with your grid region's rate. A property can have its own list, for a green tariff or a different utility, which replaces the default for that property.
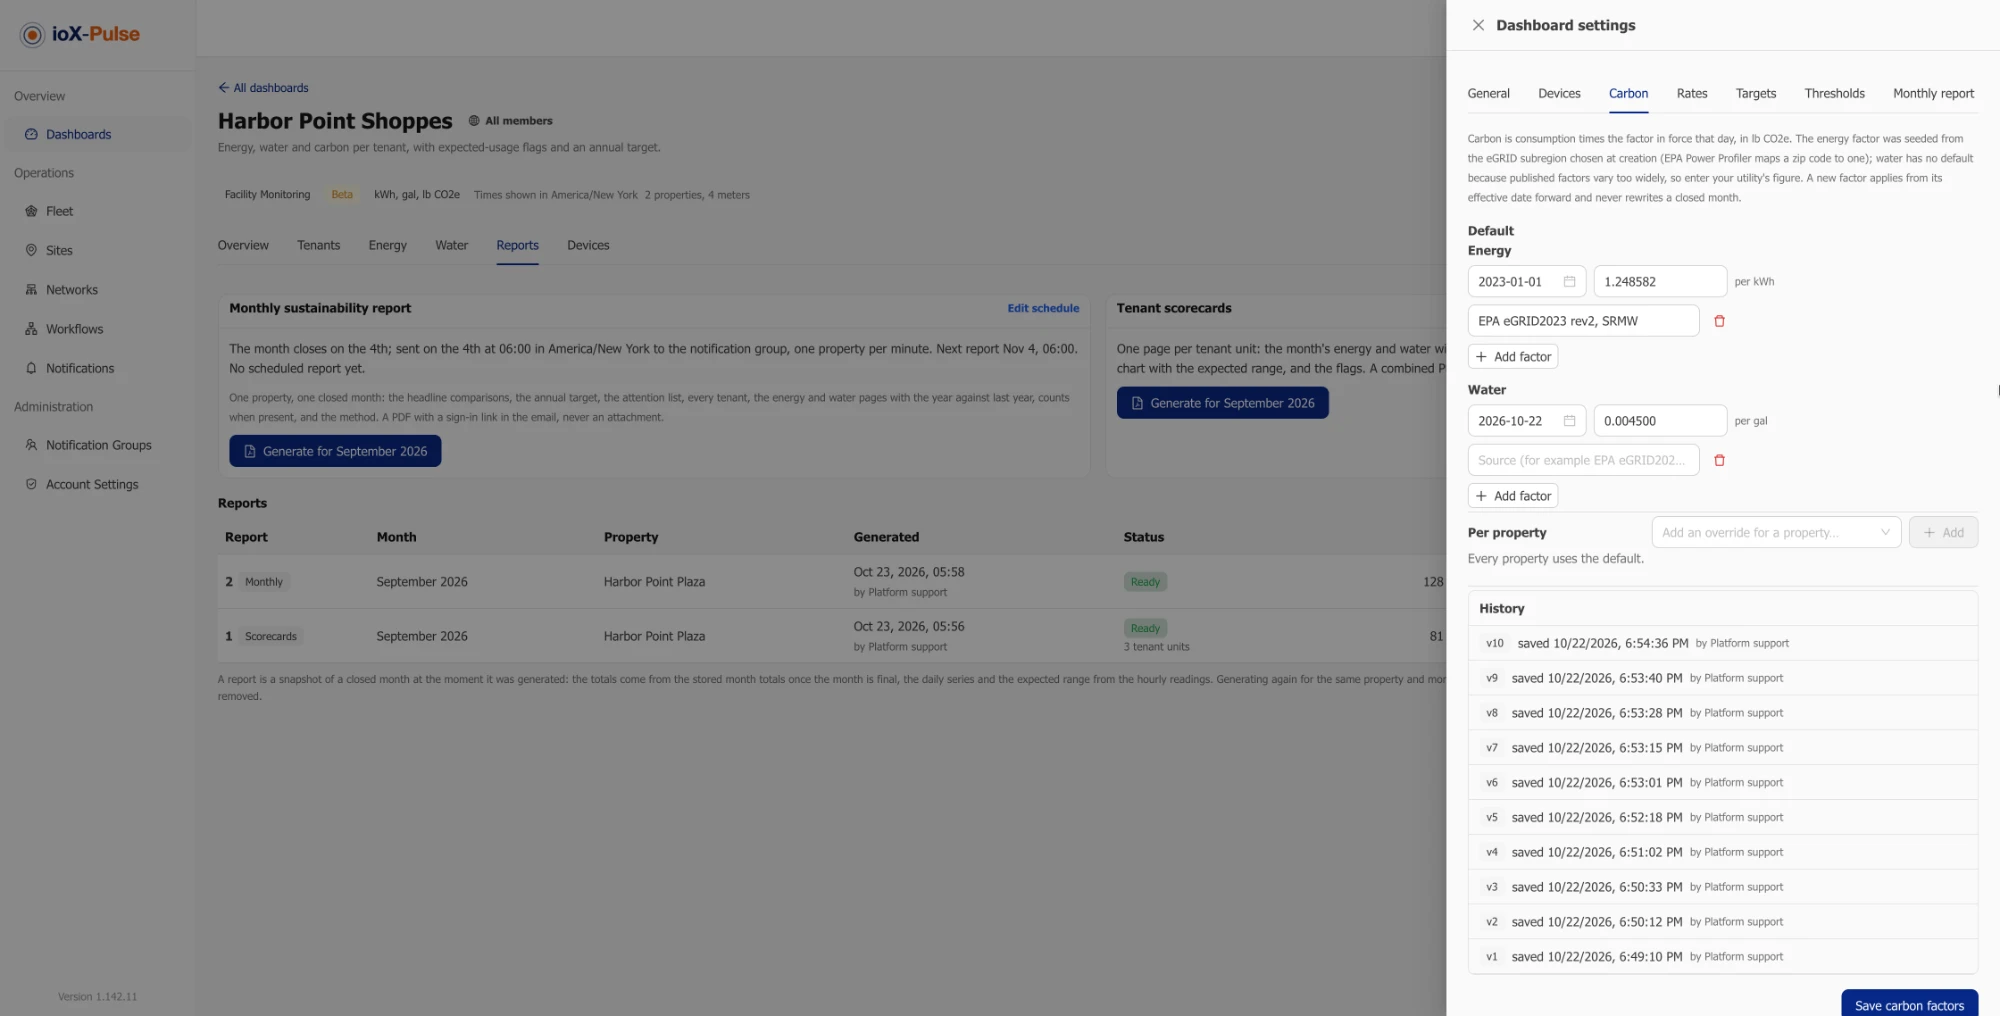
Water has no shipped factor, because published figures vary widely with the supply and treatment behind each utility (roughly 0.02 to 0.56 kg CO2e per cubic meter across U.S. cities, more where water is desalinated). Your utility's sustainability report is the usual source. Until a water factor is entered, water carbon stays blank and the Overview lists it under Setup.
A factor edit applies from its date forward, including the open month. A closed month keeps the carbon it was closed with, and the tiles say priced for N of M days when some days of a month had consumption and no factor.
Rates
Rates are optional and are only for orientation: under Settings, then Rates, a blended price per kWh and per gallon or liter, with effective dates, as a default and per property. With a rate entered, the tiles show an estimated cost and a flagged day's excess is also shown in dollars. Without one, no dollar figure appears anywhere. The tenants' real rates, tiers and invoices live on the Tenant Sub-metering dashboard.
Annual targets
Under Settings, then Targets, set a year and a reduction in percent per commodity, as a default and per property; a negative number is an allowed growth. Progress is the year to date against the same span of the year before: the closed months from the stored totals, plus the open month as its daily average against last year's daily average. The tile says On track at or under the reduction, Close within three points, Off track otherwise, and Not enough history while any month of this year or last is missing from the stored totals, because a partial ratio would mislead. The target line on the Energy and Water tabs is last year's month reduced by the target percent.
Reports and scorecards
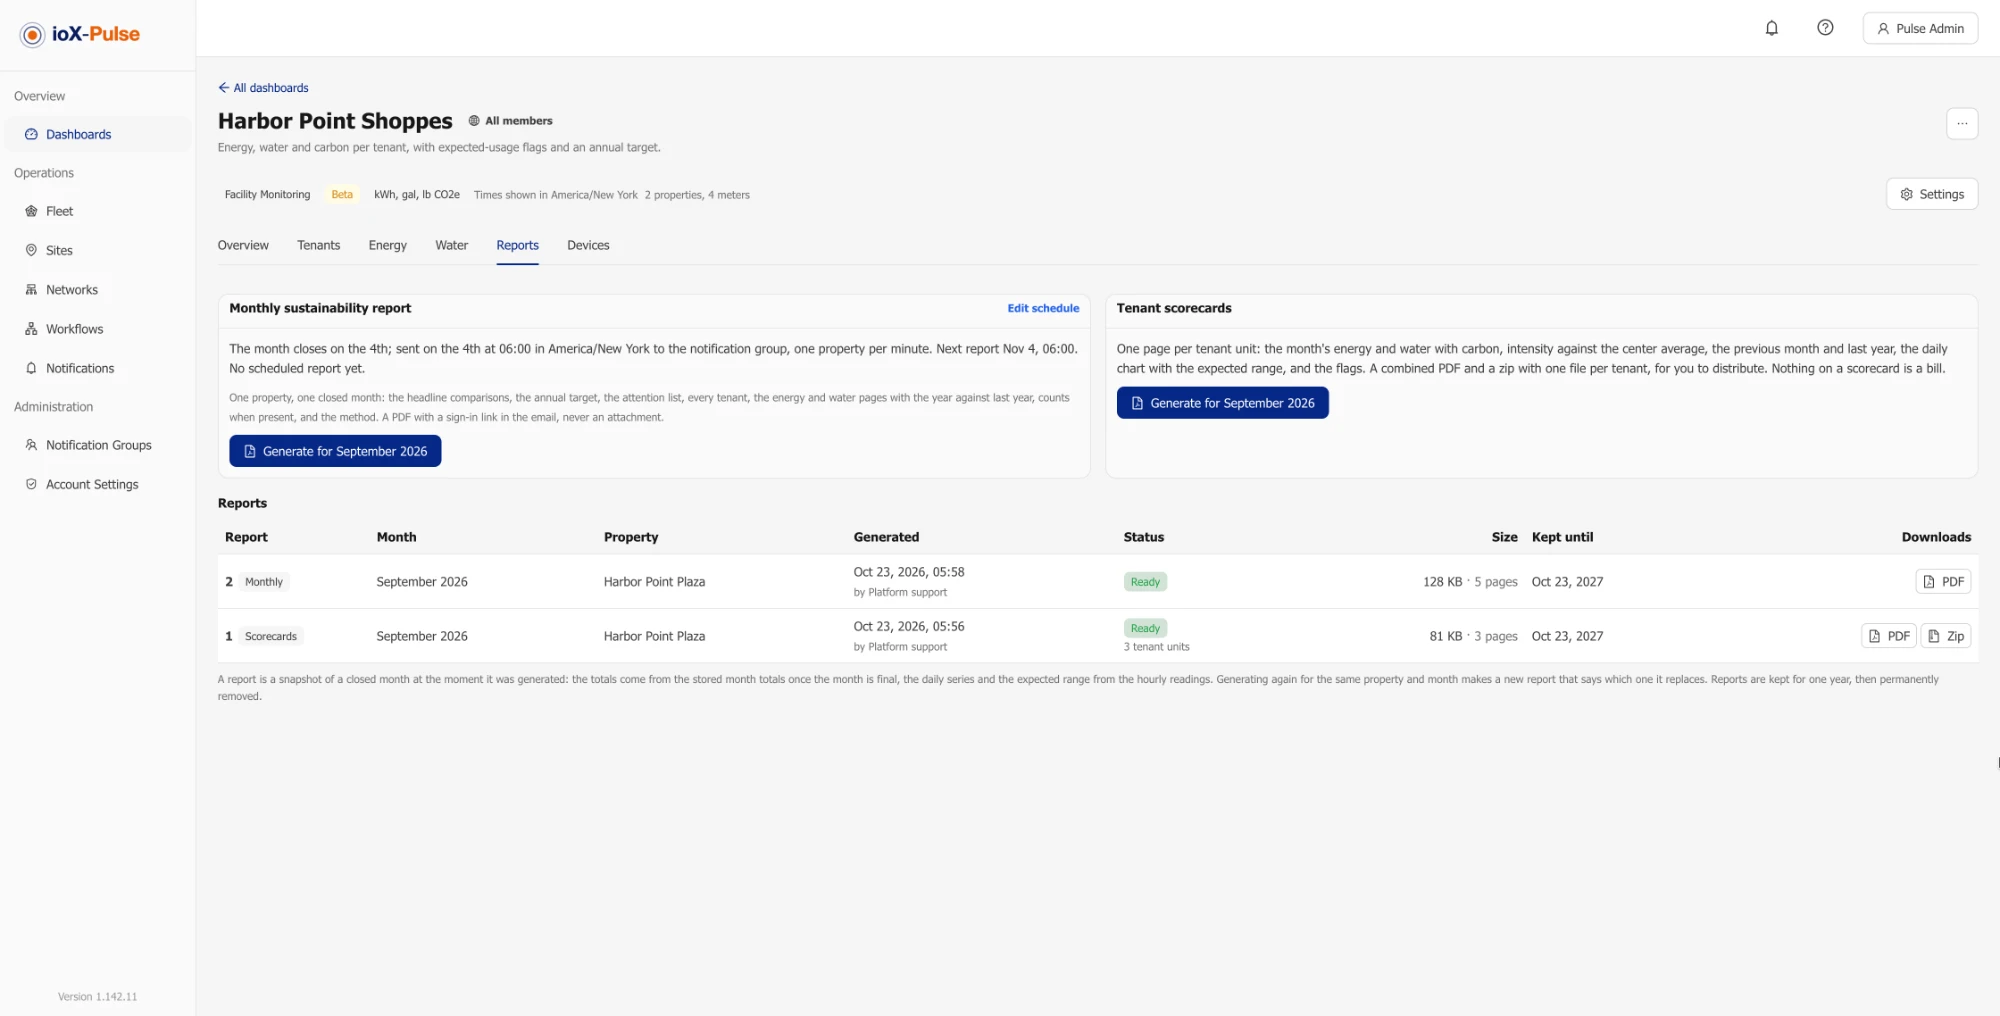
Monthly sustainability report
One PDF per property per closed month: a cover with the three headline figures and both comparisons, the carbon, the annual target status and the attention list; every tenant ranked by change; an Energy and a Water page with the year's monthly bars against last year, the daily series with the expected range and the exceptions; a Counts page when a counter is present; and a method page naming the factors with their sources and dates, the meters included and how every figure was computed.
Under Settings, then Monthly report, turn the monthly email on, choose a notification group, the day of the month (the 4th at the earliest, so the month has closed) and the send time in the dashboard's time zone. On that day, the dashboard builds last month's report for each property, one property per minute, and emails the group's email members the headline comparisons, the target status and the top consumption exceptions under Act now and Check, each naming the property, the tenant unit, the figure and the flagged days (silent meters and setup notes are not emailed; they stay on the Overview and in the report), with a link to the report on the Reports tab; the subject line says how many exceptions there are, and the file needs a sign-in and is never attached. Saving the schedule after this month's send time waits for next month. The Settings section and the Reports tab show when the next report goes out, or due now.
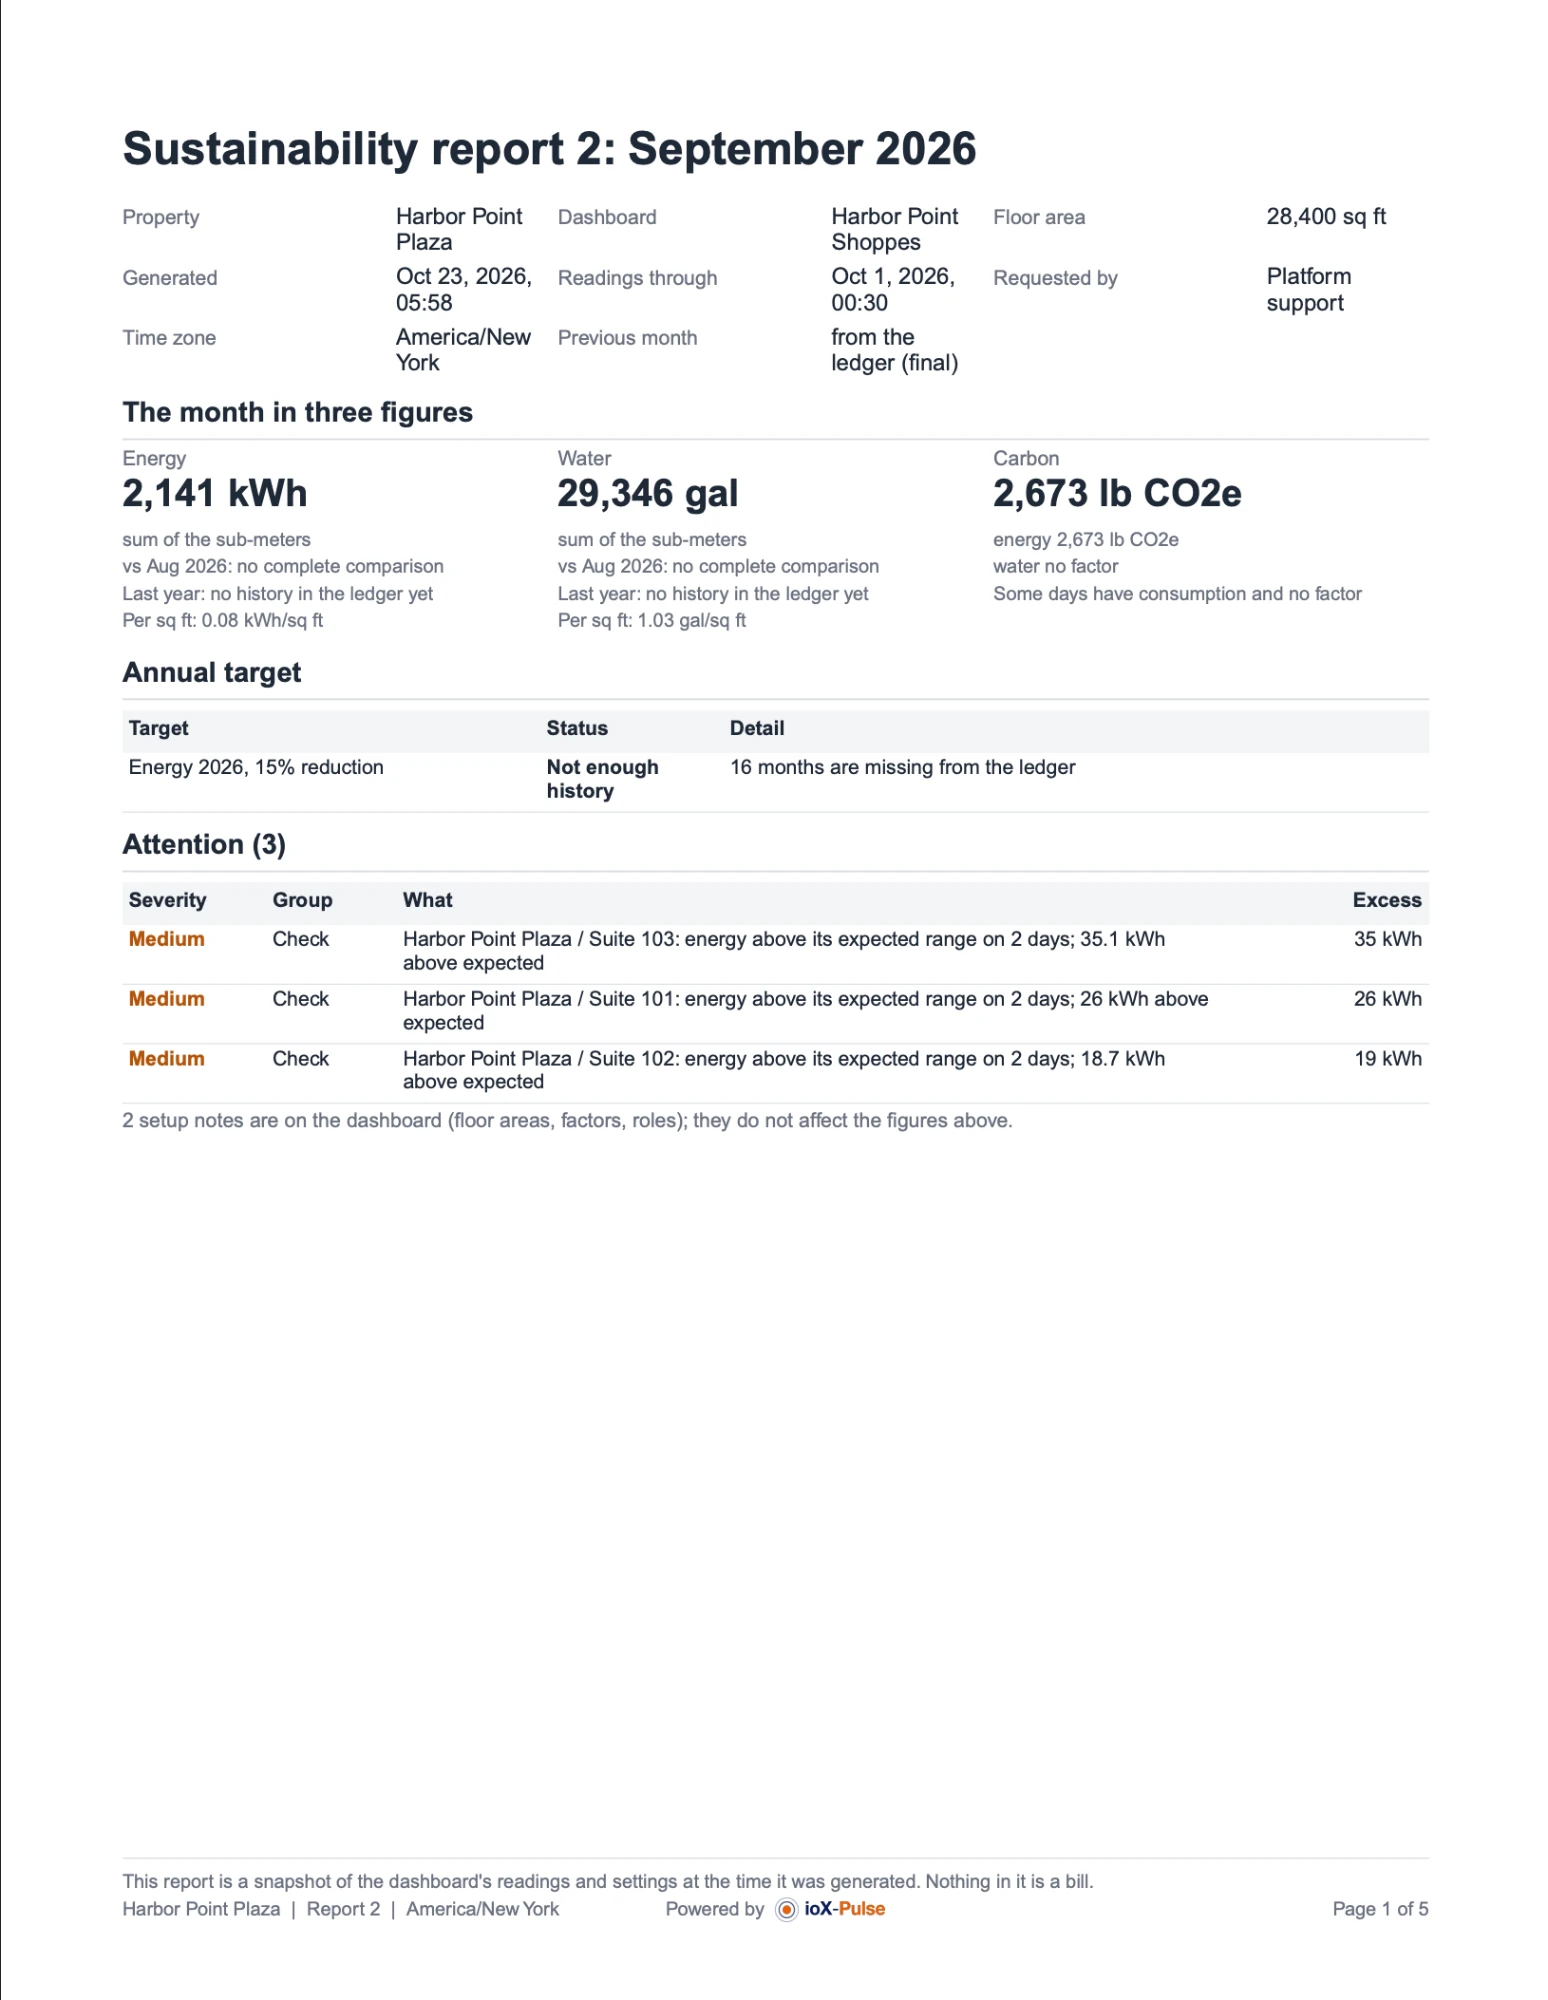
Generate for last month on the Reports tab makes the same report on demand for any closed month of the last twelve, for the property you choose; you get an email when it is ready.
Tenant scorecards
Generate for last month on the scorecards card makes one page per tenant unit of a property for a closed month: the unit's energy and water with carbon, its intensity against the center average over the units with a floor area, the previous month and last year, the daily chart with the expected range and the flagged days, the flags with their excess, and a one-line method footer. You get a combined PDF and a zip with one PDF per tenant, named by set number and unit, for you to distribute. The dashboard does not email tenants.
A report is a snapshot. It does not change if readings arrive later, and generating again for the same property and month makes a new report that says which one it replaces; the earlier one stays listed. Reports are kept for one year, then permanently removed.
Stored month totals
Each month is stored once it has closed, from the 4th, one meter per measure per month, with its carbon at the factors in force. The stored totals carry everything that outlives your plan's hourly history: the vs last year comparison, the 13-month chart, the target progress and the monthly report. The open month is always live. When you change the device selection or a meter's role, the months inside your plan's hourly history are recomputed and the chart marks them until that is done; earlier months keep their stored values. A month in which no meter reported has no total, and the chart says no readings.
What the terms mean
| Term | Meaning |
|---|---|
| Tenant unit | The site a tenant meter sits in; the thing a scorecard is for. |
| Main meter | A meter for the whole property; the property's total when it has one. |
| Common area | A meter the landlord holds for shared loads; shown as one group per property. |
| Unmetered | The main meter minus the tenant and common area meters. |
| Intensity | Consumption per square foot of the site's floor area. |
| Expected | The median of a unit's last same-weekday days with data; the range is their lowest and highest. |
| Excess | Used minus expected on the flagged days. |
| Pace | A total so far scaled to the whole month, or a daily average compared with a daily average. |
| Carbon factor | Pounds of CO2e per kWh or per gallon (liter), with the date it applies from and its source. |
| Readings through | The time of the latest reading included on the dashboard or in a report. |
Limits and things to know
- Energy in kWh, water in gallons or liters, carbon in pounds of CO2e only. Gas, other fuels and other units are not part of this dashboard.
- Periods are calendar months in the dashboard's time zone, or a custom range of whole days up to 92.
- The dashboard reads the hourly summaries your plan keeps, so a comparison that reaches further back than that comes from the stored month totals, or shows no history before the dashboard existed.
- Vehicle and people counts are separate measures and are never added together; a counter counts with its property.
- Up to 500 meters and counters per dashboard.
- The dashboard reports; it does not notify about a single meter. For an alert on a silent meter, a flow that never stops or a count past a threshold, use Workflows on the devices themselves.